


Key Insights:
- Binance coin’s chart bearish formation signals potential negative momentum, prompting investor vigilance amidst rapid price growth.
- BNB’s price stabilization at around $500 hints at a potential upward trend, with resistance at $550 looming large.
- A breach beyond the $550 resistance could propel BNB toward $580, while failure may lead to a further decline toward $430 support.
Binance Coin (BNB), the prominent utility token of the Binance ecosystem, has seen a remarkable surge in 2024, which is in line with the overall bullish sentiment in the crypto market. However, its recent climb to $645 has hit a snag as signs of a potential slowdown emerged. However, the recent observations of bearish formations on the BNB price chart have cast a shadow of caution among investors.
As of this writing, BNB was trading at $529, up by 4% in the past 24 hours, as bullish momentum has been restored. BNB has been forming higher highs and lower highs on the daily chart as the price recovers from the recent downtrend. The market capitalization is on the increase, rising to $79 billion, while the daily trading volume records a significant decrease of 26% to $3 billion.
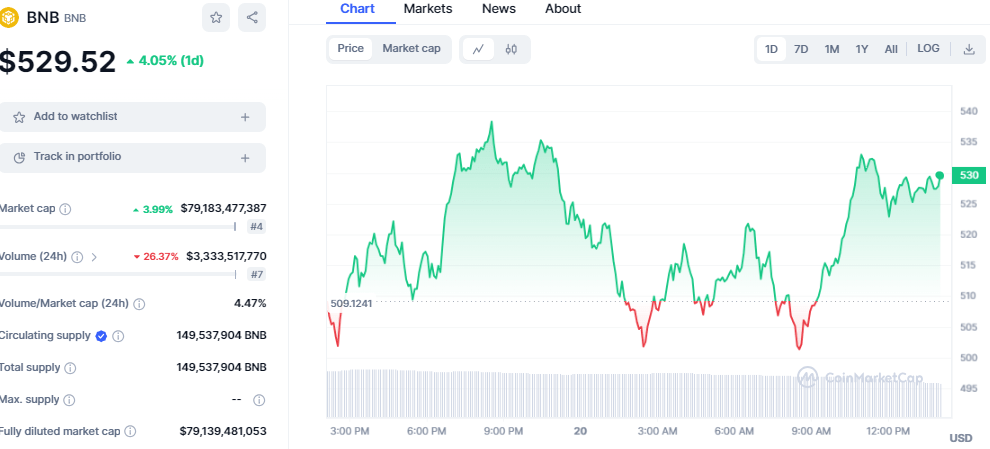
BNB/USD price chart: CoinMarket Cap
Binance Coin encounters a crucial juncture in its price journey as it tests the $500 support level, signaling a potential turnaround from recent declines. After surging past the $600 mark, BNB faced resistance, leading to a corrective phase. Now, hovering above $500, the cryptocurrency shows signs of a rebound, hinting at a possible uptrend.
Amidst price fluctuations, BNB eyes a resistance at $530, represented by a significant downtrend line. Surpassing this barrier could pave the way for a robust performance, whereby BNB could target the $550 hurdle, aiming for a rally towards $580 and a retest of the $645 level, showcasing its resilience in the market.
However, failure to breach the $530 barrier poses risks of extended downturns. Immediate support lies at $500, with stronger backing at $470. Yet, the pivotal support at $430 holds BNB’s fate, with a breach potentially triggering a slide towards $400 and beyond, emphasizing the criticality of current levels.
Could Binance Coin Dip Further?
A notable concern lies in the dwindling number of transactions on the Binance Chain.

Since January 2024, BNB’s transaction count has remained relatively steady, albeit with intermittent spikes. Yet, in recent days, the daily transaction volume has exhibited a consistent decline, hinting at waning interest among users or a shift towards alternative opportunities with perceived higher returns. Such a dip in transaction activity may signal weakening fundamentals, which could influence price movements in the near future.
Binance Coin Technical Outlook
Looking at BNB’s technical indicators, the Relative Strength Index (RSI) is currently standing firmly in the overbought territory. This suggests that the market has heavily favored the asset, possibly leading to an overvaluation. Consequently, the likelihood of a price correction or pullback increases as some investors may opt to sell and realize profits.
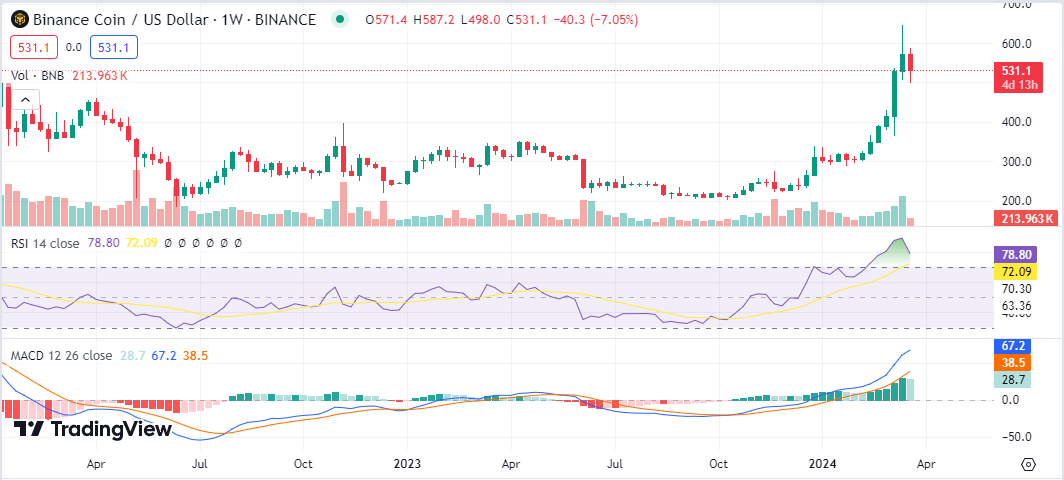
BNB/USD chart: TradingView
Moreover, the Exponential Moving Average (EMA) lines, which offer insights into an asset’s momentum and potential price direction, present a bearish signal. The 20 EMA is dipping toward the 50 EMA, indicating a weakening short-term momentum relative to the medium-term. Should a crossover occur imminently, traders may interpret it as a sign of continued decline unless other indicators hint at a shift in momentum.


