


Key Insights:
- Bitcoin’s current consolidation phase above $60,000, now in its sixth week, signals strong market confidence and a potential precursor to a bull run.
- Despite low net inflows, the robust volume in Bitcoin ETFs reflects a healthy market, with ETF shares actively traded, mirroring the spot market’s consolidation.
- Recent gains see Bitcoin trading confidently above $72,000, with immediate hurdles at $72,500 and $73,000.
In an analysis that sheds light on Bitcoin’s readiness for a potential surge beyond the coveted $100,000 mark, expert point to a combination of market confidence, strategic ETF behaviors, and the broader economic landscape as key factors fueling this optimism.
The analysis, provided by Joe Consorti of Theya Research, underscores the significance of the cryptocurrency’s ongoing consolidation phase as well as the critical role of exchange-traded funds (ETFs) and the spot market in setting the stage for Bitcoin’s next major price movement.
Bitcoin’s Consolidation: A Sign of Strength
As Bitcoin continues to trade above the $60,000 threshold for the sixth consecutive week, its stability at this level is highlighted as a strong indicator of market confidence. Consorti emphasizes, “Bitcoin continues its consolidation, marking the least volatile period at this price level following a new all-time high.” This pattern of behavior not only reflects a balancing act between buyers and sellers but also suggests that the groundwork is being laid for a significant upward trajectory.
The Broader Economic Context
The analysis also delves into the wider economic environment, noting peculiar market dynamics that have unfolded in recent cycles. The decoupling of traditional economic indicators from the stock market’s performance is seen as a factor that inadvertently benefits asset prices, including Bitcoin. According to Consorti, “The market at large has experienced massive correlation breaks this cycle,” pointing to the resilience of businesses extending their debt maturity in 2021 and the impact of the US Treasury’s fiscal policies as contributing factors.
ETF Dynamics and Spot Market Stability
Another focal point of the analysis is the interaction between Bitcoin ETFs and the spot market. Despite witnessing one of the lowest weeks for BTC ETF inflows, the overall market volume remains high, suggesting active trading and a healthy market. “This was one of the lowest weeks yet for BTC ETF inflows, although when you net in the outflows, they are still healthy compared to previous weeks,” Consorti remarks, indicating a parallel between ETF share trading and spot market consolidation.
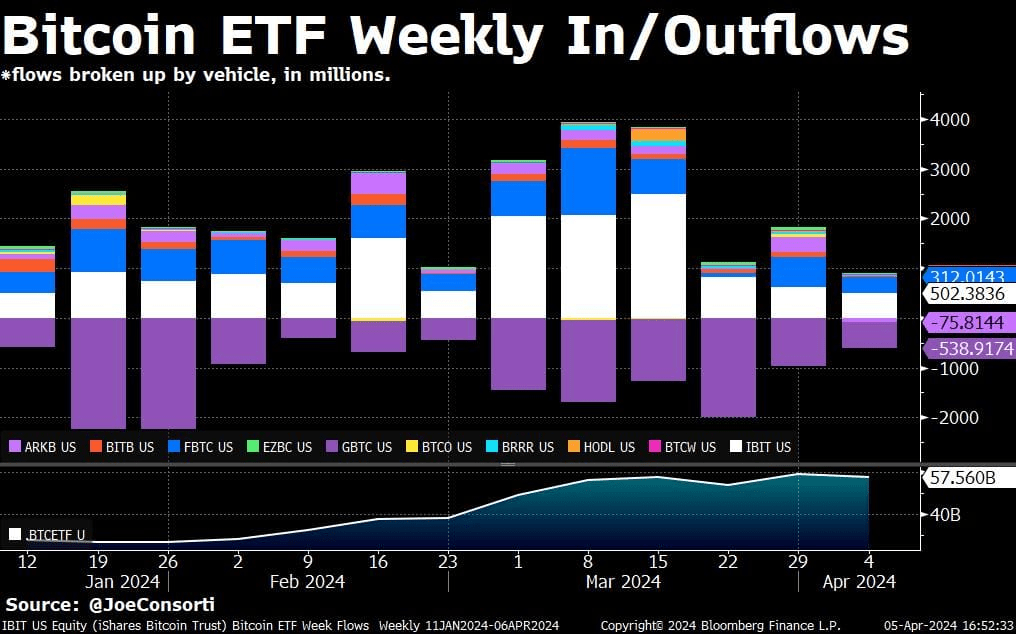
The analysis posits that the muted funding rate in the perpetual futures market, coupled with the spot market’s increasing influence on Bitcoin’s price action, bodes well for the stability and sustainability of the upcoming bull run. Consorti concludes, “In this period of consolidation, the spot market has really taken control of Bitcoin price action,” underscoring a more robust foundation for future growth.
Bitcoin Price Analysis
As of press time, Bitcoin is trading at $72,139, marking an increase of 4.93% on the last day. This contributes to a total rise of 4% over the past week. Additionally, looking at the performance over the previous month, it has seen an upturn of 5.50%. The market cap has climbed above the $1.4 trillion mark as the bulls outshine the bears. In addition, the trading volume has seen an impressive surge of 70%, with a value of $34 billion.
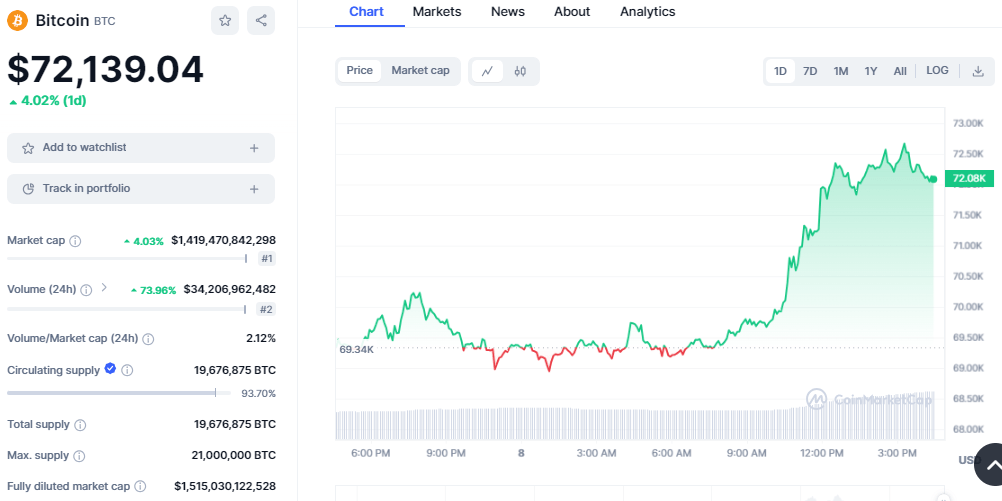
BTC/USD price chart: CoinMarket Cap
Bitcoin has effectively breached the $70,000 resistance level, charting a course through a previously contested zone. This upward trajectory commenced as BTC powered through successive resistance levels at $69,000 and $69,500, firmly positioning itself within a bullish domain.
Moreover, the digital currency’s rally did not falter at $72,000. Instead, it ventured beyond, reaching a peak near $72,500 before undergoing a slight correction. Despite this, Bitcoin’s value remains robustly above $72,000, with the market’s eyes set on the immediate resistance pinpointed at the $72,500 mark.
Additionally, Bitcoin enthusiasts and traders alike are closely monitoring the next resistance levels. A decisive climb above $73,500 could potentially pave the way for an uptrend toward the $74,000 threshold, followed by an encounter with the $74,500 resistance zone. Such advancements could further propel Bitcoin towards the highly anticipated $75,000 mark in the near term.
However, the journey is full of potential setbacks. A failure to eclipse the $72,500 resistance might trigger a downward correction, with Bitcoin seeking support at lower levels. Initial support lies at $71,500, followed by a significant foundation at the $70,000 mark. Further dips could see Bitcoin retreating towards $68,800, and a breach below this level might escalate losses towards $66,500, eventually testing the resilience at the $65,000 support zone.
Bitcoin Technical Analysis
According to the one-hour and one-day chart analysis, Bitcoin is exhibiting a buoyant trend. The chart presents a sequence of higher highs and higher lows, a clear sign of a strengthening uptrend. The buying pressure behind the premier cryptocurrency remains substantial, propelling its value forward in a positive direction.
The technical indicators align with the bullish sentiment; moving averages (MAs) are predominantly positive, which tends to signal a favorable market environment for continued growth. Meanwhile, oscillators present a mixed but generally optimistic picture, suggesting that while caution is warranted, the current momentum is tilted toward the bulls.
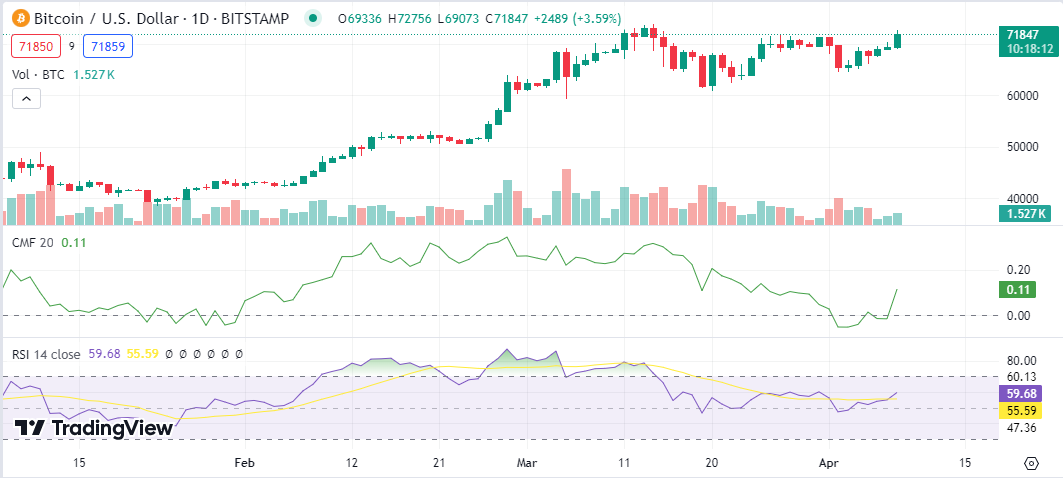
BTC/USD 1-hour chart: TradingView
The Chaikin Money Flow (CMF) indicator is hovering around the 0.11 mark, which points to a moderate inflow of money into Bitcoin, reinforcing the positive outlook. At the same time, the Relative Strength Index (RSI) sits comfortably above the mid-line but below the overbought threshold, indicating there’s room for further movement without immediate concerns of being overextended.
Observing the 20-day Exponential Moving Average (EMA) with interest as it holds at 68,377 suggests that the overall trend for Bitcoin has been leaning towards the upside. Such a sustained position above the EMA often signals bullish market sentiment and could foreshadow further gains if the trend persists.

BTC/USD 1-day chart: TradingView
Further intensifying the bullish narrative, the Moving Average Convergence Divergence (MACD) indicators present a compelling story. The MACD line (blue) has risen to a level of 1288, with the signal line (orange) trailing at 1404, indicating a potential momentum shift. The histogram, though currently negative at -116, appears to be on the cusp of crossing into positive territory, which could forecast an incoming bullish phase if the upward trajectory continues.


