


Key Insights:
- ADA’s journey hits a consolidation phase, trading between pivotal resistance and support zones, signaling a cooling period.
- Despite a recent pullback from its yearly high, ADA’s long-term prospects continue to spark optimism among investors
- Cardano’s derivatives market open interest spikes, indicating strong investor confidence and market activity.
The price of Cardano (ADA) remains subject to the wider market trends, hinting at a possible downturn within the altcoin space. Nonetheless, the actions of investors reflect a keen anticipation for a rise in value.
Despite the prevailing downward market cues, investors’ enthusiasm for Cardano stands firm. This optimistic stance is further demonstrated by the increased capital influx seen in the derivatives market.
As of press time, ADA is trading at $0.6499, down by 0.37% in the past 24 hours. ADA has been trading on the positive region during the day only to face a pullback as the bear’s mounted pressure. The trading volume has faced a significant decline of 20%, with a value of $418 million. The market cap, too, has faced a mere decrease to stand at $23 billion.
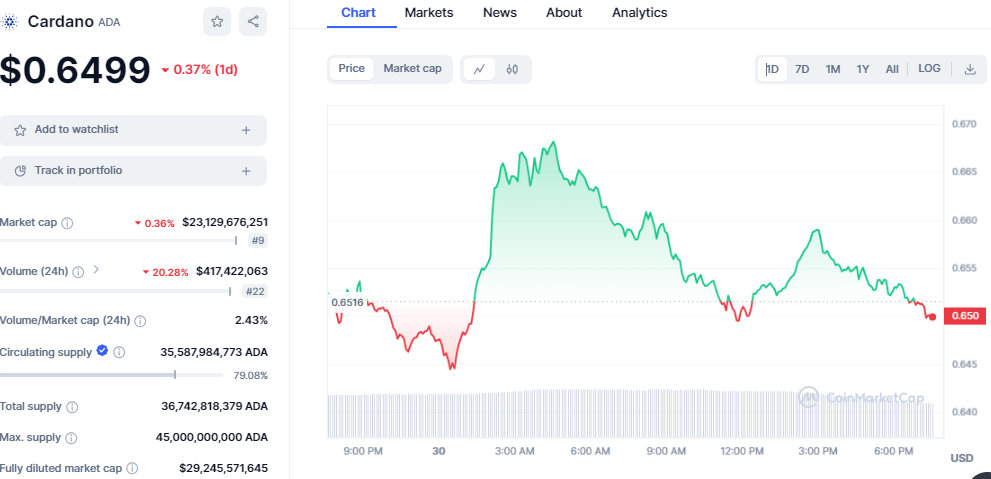
ADA/USD price chart: CoinMarket Cap
ADA Sees Consolidation After Peaking
Crypto analyst Trend Rider recently provided insights into ADA’s current market behavior, noting a period of consolidation after reaching a high for the year. After peaking at $0.811 on March 14, ADA’s price now fluctuates within a defined range marked by a significant resistance level and a supporting band. This trading pattern signals a cooling-off period as the digital asset gears up for its next significant movement.
Moreover, the analyst highlighted a slight decrease in the trend’s bullish intensity over the last two weeks. This observation suggests ADA’s upward trajectory may experience a temporary pause, leading to a phase of sideways trading. However, the broader sentiment remains positive, with expectations of future gains still intact.
Cardano Derivatives Market Sees Spike
In the derivatives market, Cardano has become a beacon of optimism among investors. Over the past week, open interest, the total of unsettled derivative contracts like futures and options, climbed more than 10%. This rise, from $384 million to $455 million, underscores a burgeoning confidence in Cardano’s future market performance.

ADA Open Interest: Coinglass
High open interest typically signifies heightened market activity and liquidity, reflecting strong trader engagement and possible price swings. The recent surge suggests investors are placing bullish bets on Cardano, further evidenced by the positive funding rate. Moreover, this investor optimism persists even as it contrasts with the broader market’s bearish signals.
Additionally, the increase in open interest not only highlights a solid interest in Cardano but also suggests a vibrant trading environment. This development could pave the way for more dynamic price movements in the near term, drawing even more attention to Cardano’s potential in the derivatives market.
Cardano Price/Technical Analysis
Cardano’s market position recently witnessed a minor setback, dipping below a crucial uptrend line that had been holding for the past week. This slip also led to the cryptocurrency losing its grip on the support provided by the 50 and 100-day Exponential Moving Averages (EMAs).
This development has stirred up conversations among investors and analysts alike. Factors that previously fueled its rise could empower ADA to regain these vital EMAs, potentially resuming its upward trajectory.
Moreover, this could propel the third-generation cryptocurrency beyond a notable resistance point at $0.68. Turning this level into firm support could pave the way for ADA to surpass the $0.70 mark. Such a movement would set the stage for Cardano to aim for a target of $0.74, marking a significant rebound in its market valuation.
On the flip side, a break below the $0.63 support could expose Cardano to a potential decline towards $0.60 and possibly even down to $0.59. This latter figure coincides with the 200-day EMA, a critical juncture that, if breached, could challenge the optimistic outlook for the currency.
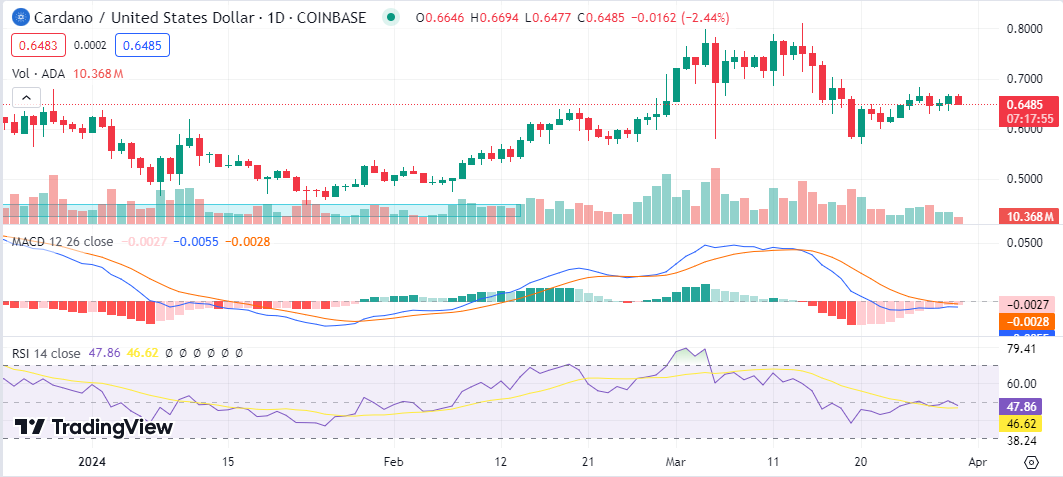
ADA/USD chart: TradingView
The current market indicators provide a mixed bag of signals. The Relative Strength Index (RSI), positioned at 47, teeters on the edge, signaling a bullish breakout. A push above the 50 mark would confirm such a trend. Meanwhile, the Moving Average Convergence Divergence (MACD) retains its bullish crossover, albeit with diminishing momentum.


