


Key Insights:
- The stability in BNB’s daily transactions amidst price volatility signals a solid foundation of investor confidence and market resilience.
- Binance Coin’s struggle with key resistance at $632 and $656 could set the stage for a breakthrough to record highs.
- Despite bullish signals, weakened buying pressure and bearish technical indicators hint at possible short-term corrections.
The cryptocurrency market is witnessing a resurgence in 2024, sparking renewed interest among investors drawn to the sector’s innovative potential. Among the standout cryptocurrencies, Binance Coin (BNB) is capturing attention for its significant role within the Binance exchange ecosystem. Utilized for trading fee discounts, staking rewards, and token sale participation, Binance Coin’s versatility is a key factor in its appeal.
Optimism surrounding Binance Coin’s prospects is on the rise, fueled by the expanding Binance ecosystem and broader adoption of the Binance Smart Chain (BSC). Moreover, potential regulatory advancements are anticipated to benefit well-established platforms like Binance. This combination of factors is leading some to predict a new all-time high for BNB in 2024.
As of this writing, Binance Coin is trading at $612, up by over 4% in the past 24 hours. Despite dropping below the $570 region during the day, BNB has showcased a bullish bias, climbing above the $600 level. Over the past week, BNB has attained a 12% gain, while the monthly gain stands at 50%.

BNB/USD price chart: CoinMarket Cap
BNB Maintains Consistent Transaction Levels in 2024
Since late February 2024, Binance Coin has exhibited an impressive steadiness in its transaction numbers. This stability comes in the wake of a significant price journey, which saw BNB escalate from $313 at the year’s onset to a peak of $632 by mid-March, doubling its value within just over two months. However, a swift correction followed, bringing the price down to $507 by March 19. Yet, BNB quickly regained momentum, climbing to $578 by March 27.
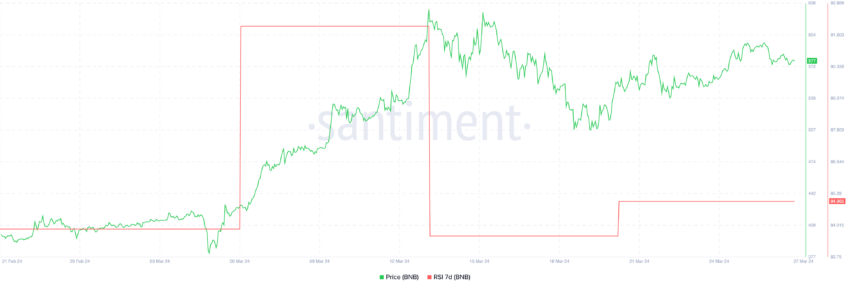
BNB RSI 7-day: Santiment
Amidst these fluctuations, one aspect of Binance Coin’s market behavior remained notably constant: the number of daily transactions. This consistent transaction activity, coupled with a steady 7-day moving average, underscores a robust level of investor trust in BNB. Even in the face of significant price movements, both upward and downward, the unwavering transaction count reflects a collective investor belief in the long-term potential of BNB.
Moreover, this stability serves as a testament to the enduring appeal of Binance Coin within the crypto market. It suggests that, despite short-term price corrections, the promise of continued robust returns keeps the investor community anchored. Consequently, this steady stream of transactions highlights not just the resilience of Binance Coin amidst market volatility but also its investors’ sustained interest and confidence.
Technical Patterns and Indicators Insight
Binance Coin has recently been the subject of keen market analysis. The digital asset finds itself navigating through a technically challenging landscape, marked by both promising bullish signals and looming bearish indicators. As Binance Coin inches closer to key resistance points, the community watches closely, anticipating its next move.
Currently, BNB is wrestling with an upward-sloping wedge, traditionally seen as a precursor to bearish outcomes. However, a break above this pattern could dramatically shift market sentiment to the bullish side. Two critical resistance levels stand in their way: the immediate hurdle at $632 and a subsequent barrier around $656. Surpassing these would clear the path towards an unprecedented peak beyond $690.
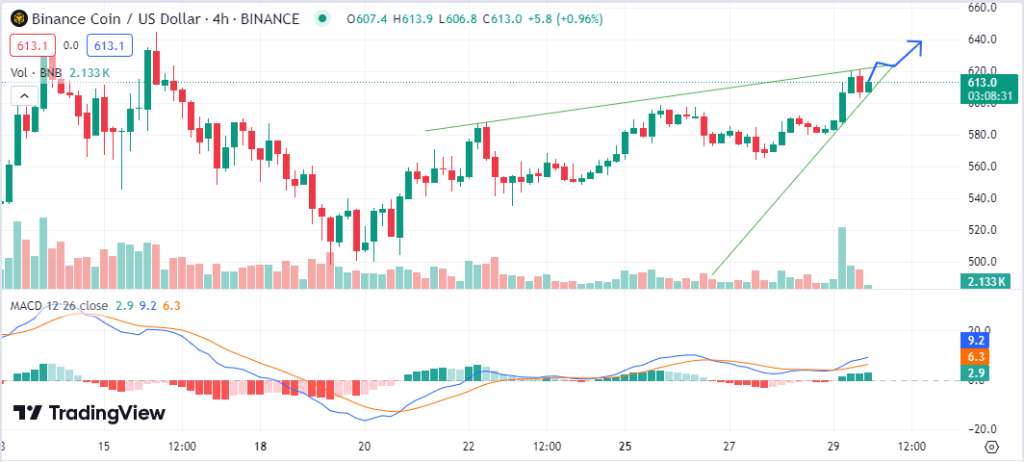
BNB’s journey is fraught with technical complexities. On the one hand, the asset’s Exponential Moving Averages (EMA) present a bullish narrative, with a short-term EMA crossing above its long-term counterpart. This crossover typically signals strengthening price momentum, suggesting potential for further gains.
BNB/USD chart: TradingView
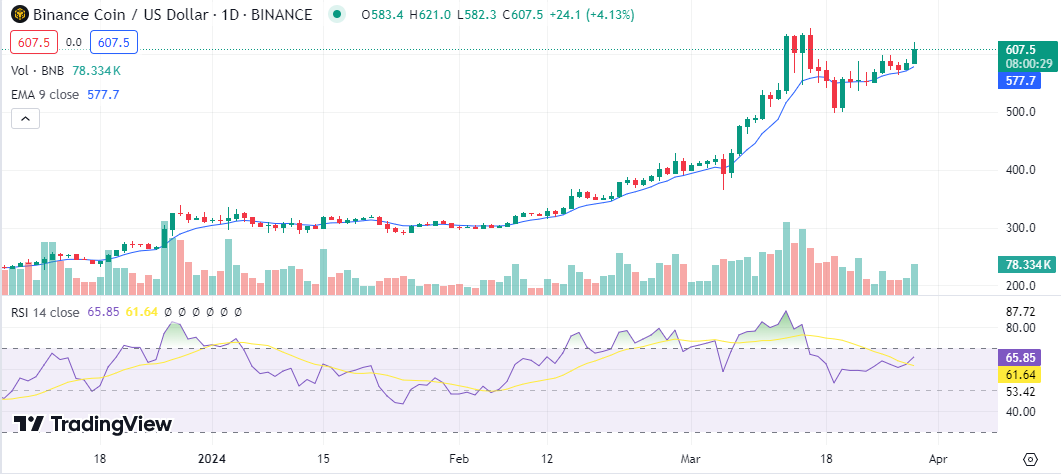
On the other hand, the Relative Strength Index (RSI) paints a cautionary picture. Peaking at 65, the RSI categorizes BNB as overbought, hinting at possible market corrections ahead. This condition suggests that the current valuation might not be sustained, as buyers could need help to maintain their purchasing spree.
Adding to the investor’s toolkit of indicators, the Chaikin Money Flow (CMF) and the Moving Average Convergence Divergence (MACD) provide additional layers of market insight. The CMF’s downtrend, coupled with a bearish crossover in the MACD, warns of weakening buying pressure despite the asset’s price increase. Such divergences often precede price corrections, underscoring the nuanced interplay of various market forces.

BNB/USD chart: TradingView
Furthermore, the Money Flow Index (MFI) and Bollinger Bands (BB) contribute to a more nuanced understanding of BNB’s current state. With an MFI indicating dominance of selling pressure and the BB signaling low volatility, the stage is set for a potential consolidation phase. These indicators suggest that while immediate substantial price swings may be unlikely, the asset’s valuation is under meticulous examination.
BNB’s market outlook is a complex tapestry of bullish and bearish signals. While the possibility of breaking through key resistance levels exists, indicators like the high RSI, bearish CMF, and MACD suggest a cautious approach. The asset’s future movements will heavily depend on its ability to maintain momentum and navigate through the identified technical barriers.


