Key Insights:
- Bitcoin and Ethereum’s surge boosts the global crypto market cap beyond $2.5 trillion.
- Currently, at $3,467, Ethereum exhibits robust bullish momentum, with weekly and monthly gains of 11% and 50%, backed by a notable 50% surge in daily trading volume.
- Technical analysis points to a bullish trend for Ethereum, supported by strong market indicators.
In a remarkable display of strength, the crypto market has witnessed a spectacular performance, with Bitcoin and Ethereum prices soaring. Over the past 24 hours, Bitcoin surged 3.7% to surpass the $64,000 mark, while Ethereum experienced a 1.70% increase, pushing its value over $3,500. This surge propelled the total global cryptocurrency market cap beyond the $2.5 trillion mark.
Ethereum Current Price Action
As of this writing, Ethereum is exchanging hands at $3,467 as bullish momentum prevails. As ETH’s price consolidates around the $3,400 region, the weekly and monthly gains stand at 11% and 50%, respectively. The daily trading volume is on the rise, too, gaining an impressive surge of 50%, rising to $16 billion today while the market capitalization climbs to $416 billion.
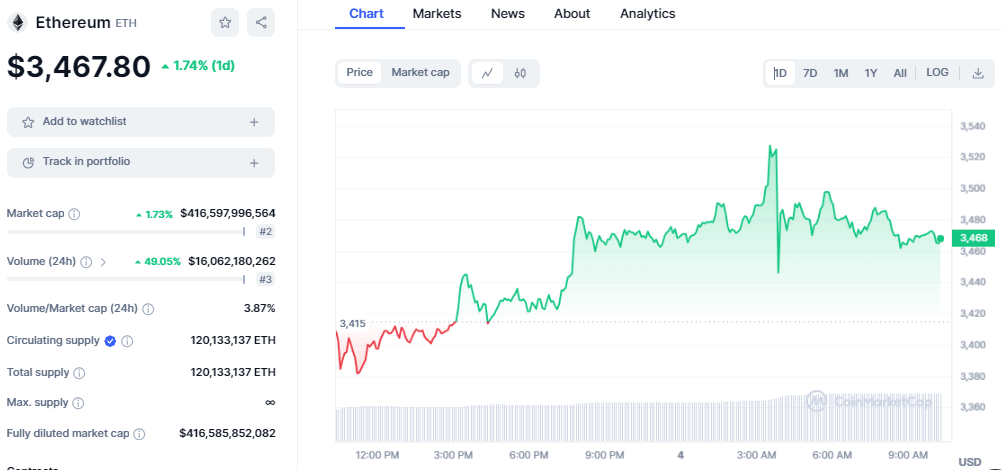
ETH/USD price chart: CoinMarket Cap
Ethereum’s current price positions it between the support at $3,370 and the resistance at $3,500. The immediate resistance on the upside is near the $3,500 level, with major resistance at $3,520 and $3,550. A breakthrough above $3,550 could pave the way for bullish momentum, targeting the $3,650 and even $3,720 levels. Further gains might test the $3,800 mark.
However, a downside correction could ensue if Ethereum fails to clear the $3,520 resistance. Initial support on the downside is near $3,420, and the trend line is followed by major support at $3,400 and $3,350. A breach below $3,350 may lead to a downturn towards $3,320, with potential further losses to the $3,150 level.
Ethereum Technical Outlook
Technical analysis of Ethereum’s performance in the past week reveals a bullish trend, marked by a rising channel pattern. The breakout on March 2nd signals positive momentum, supported by indicators like the Awesome Oscillator, indicating a prevailing bullish sentiment despite overbought conditions.
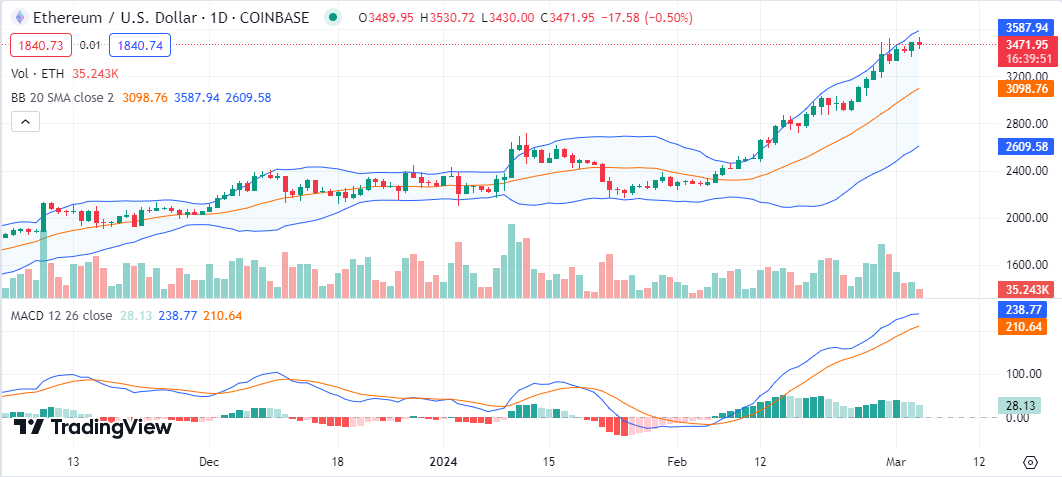
ETH/USD chart: TradingView
The Relative Strength Index (RSI) is currently in the overbought region with a value of 80, indicating a cautious market as a price correction could be imminent. Looking at the Moving Average Convergence Divergence (MACD) indicator, the MACD line is currently positioned above the signal line, suggesting a strong bullish momentum.
The Bollinger Bands are widening, indicating an increase in volatility as the price continues to climb to new highs. ETH is currently trading alongside the upper-band at 3587. However, a red candlestick has formed on the upper band, which indicates a rejection that could lead to a trend reversal toward the support level.