Key Insights:
- XRP has faced a challenging start in 2024, with a significant price drop from $0.62 to $0.49, indicating a bearish market trend.
- Ali Martinez’s analysis of XRP’s TD Sequential indicator suggests an imminent reversal, offering traders a strategic buying signal.
- Technical indicators like RSI and MACD reflect XRP’s bearish momentum yet hint at an upcoming reversal opportunity.
The native crypto token of Ripple has been struggling with a downtrend since the start of 2024, dropping from a high of $0.62 to the recent low of $0.49. XRP rallied from the $0.55 mark and climbed above $0.60 after the much-anticipated Spot Bitcoin ETFs from the U.S. Securities and Exchange Commission (SEC).
However, XRP failed to hold above the $0.60 level amid the abroad altcoin frenzy and formed a descending triangle, and since then, it has been down from this pattern. Over the past month, Ripple has lost over 10%, while the weekly loss remains at 2%.
XRP Current Price Action
As of this writing, XRP is exchanging hands at $0.4998, down by 0.66 percent on the daily timeframe. Ripple kicked off today’s session on a low note, rising from $0.49 to face resistance at the $0.51 mark, thus facing a minor pullback to the $0.50 level.
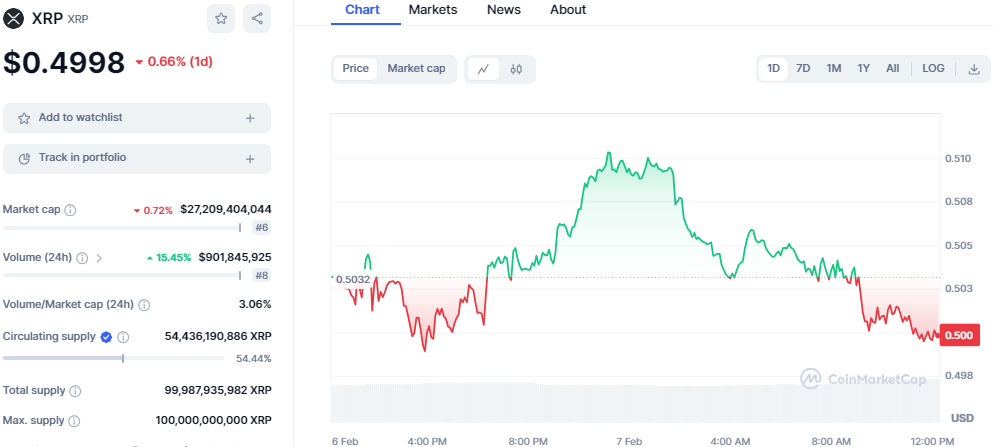
XRP/USD price chart: CoinMarket Cap
The market capitalization has declined, dropping to $27 billion, a decrease of 0.72%. However, the daily trading volume has seen a minor increase of 15 percent today, climbing to $901 million. The rise in trading volume suggests a favourable sentiment in the XRP market which could signal a bullish reversal imminent.
Resistance for Ripple has been noted at $0.53 and 0.55. Ripple has failed to surpass this level over the past few days amid the rise in bullish momentum. Currently, Ripple is consolidating around the $0.49 and $0.52 range, with the downtrend pattern facing a breather, suggesting a trend reversal if the bullish momentum regains.
Analyst Highlights Buy Signal in XRP’s Weekly Price Analysis
Ali Martinez, a crypto analyst, shared insights on X, revealing a buy signal in XRP’s price movements. According to Martinez, the Tom Demark (TD) Sequential indicator, a tool for identifying potential price reversals, has shown significant signs.
This indicator functions through a two-phase process, beginning with a “setup” phase lasting nine candles. This phase tracks candles of the same trend, culminating in a potential top or bottom after the ninth candle.
For XRP, completing this setup with nine consecutive green candles suggests a potential shift toward a bearish trend. Conversely, a series of red candles would indicate a buying opportunity for investors. Following the setup is the “countdown” phase, extending over thirteen candles, after which a price reversal might occur.
Martinez noted that Ripple has recently completed the TD Sequential’s initial phase, hinting at an upcoming change in its price direction. This analysis offers traders a unique perspective on when to enter or exit the market.
Technical Indicators Outlook
On the technical front, XRP exhibits a bearish bias on the daily chart. Indicators such as the Relative Strength Index (RSI) and Moving Average Convergence Divergence (MACD) have dropped into negative territory as bearish activity has taken hold. The RSI has dropped to the oversold region at 35.76, suggesting a possible price increase.
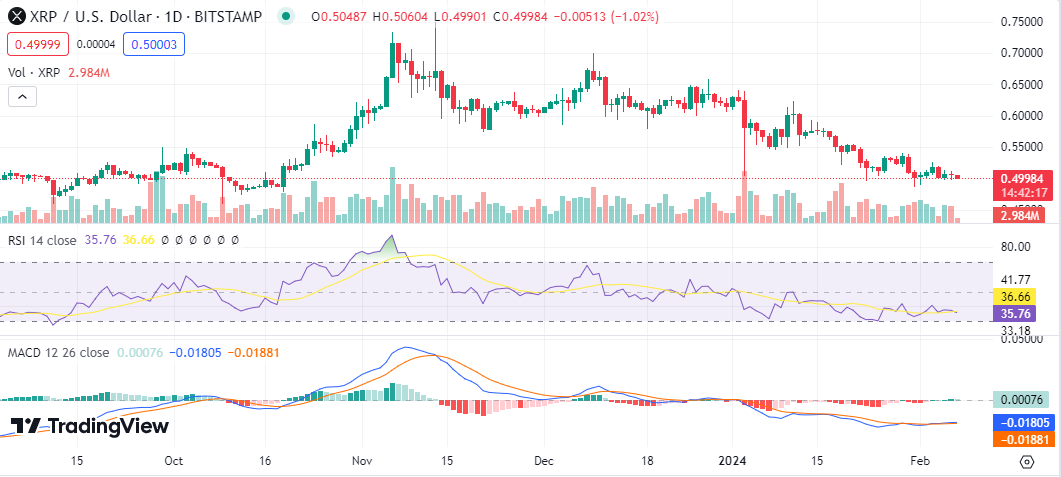
XRP/USD 1-day price chart: TradingView
The MACD indicator has remained flat as the MACD line aligns with the signal line. However, both lines remain below the zero line while the histogram shows a level of neutrality. In addition, the 20-day Exponential Moving Average shows a key resistance level for XRP since failing to break above it a few days ago.