


Key Insights:
- Ethereum has crossed the $3,000 threshold, achieving a 3% gain over the past week and becoming a top performer among major cryptocurrencies.
- Social Volume spikes and FOMO have historically signaled temporary market tops for Ethereum, as observed in its recent and past surges above $3,000.
- Ethereum surpasses the psychological $2,900 barrier, maintaining its current price of $2,954, marking a gain of over 2% in 24 hours.
Ethereum, the leading altcoin, has shown resilience in the face of market volatility, outperforming even Bitcoin with its recent ascent above the $3,000 mark. This achievement marks a significant recovery, as ETH has not reached this level since April 2022.
Over the last day, Ethereum has rallied by 2%, bouncing back from around $2,900 to current trading figures. This rise has placed it as the second-best performer in the top ten cryptocurrencies, boasting a 3% increase over the week.
Ethereum Current Price Action
In its journey to reclaim the $3,000 level, ETH encountered resistance, with prior attempts resulting in quick retracements. However, this time around, the cryptocurrency has managed to sustain its position above the $2,900 psychological barrier, with the current price standing at $2,954 with a gain of over 2% in the past 24 hours.
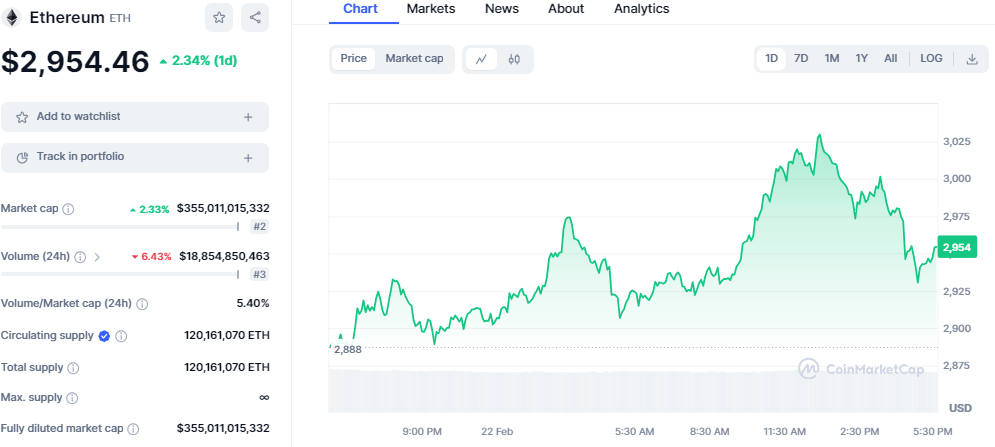
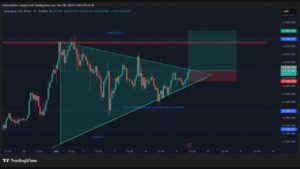
ETH/USD price chart: CoinMarket Cap
The lowest and highest prices within the last 24 hours were $2,875 and $3,030, respectively. Meanwhile, there’s been a slight decrease in trading volume over the same period.
Ethereum’s Market Analysis
Analytics from Santiment highlights a spike in Social Volume, a metric tracking the frequency of discussions across major social platforms, coinciding with Ethereum’s breakthrough. This spike indicates a heightened level of interest and celebration among traders, though such enthusiasm has previously led to short-lived surges.
FOMO, or the fear of missing out, played a crucial role in these dynamics as traders rushed to buy Ethereum amid rising prices. However, this sentiment often precedes a reversal, as the price tends to move contrary to the crowd’s expectations. A similar pattern of Social Volume spikes was evident in Ethereum’s second attempt to breach $3,000 and during its recent recovery, suggesting that trader greed might lead to another temporary peak.
In addition, several factors suggest the momentum might be sustained in the coming days, such as:
- There is excitement surrounding the possible green light for a spot at ETH ETF in the United States.
- The anticipated Dencun update.
- The expected Bitcoin halving event in April.
Ethereum Technical Outlook
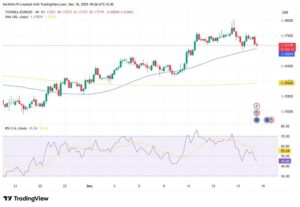
Technical indicators paint a bullish picture. Currently, the daily Relative Strength Index (RSI) stands at 73, indicating it’s in the overbought territory. This signifies strength, yet caution is advised should a bearish divergence occur (a scenario where the price increases but the RSI decreases), as it might signal an impending correction.

ETH/USD 1-day price chart: TradingView
The MACD indicator, with the MACD line positioned over the signal line, signals a bullish trend. Furthermore, the Chaikin Money Flow (CMF) indicator stands at 0.31, well within positive territory, suggesting a favorable market sentiment towards Ethereum.


