


Key insights:
- Ethereum’s exchange balance decreased by over 7 million ETH, highlighting growing scarcity.
- Ethereum’s price currently trades at $2,325, showing signs of breaking out of its consolidation range.
- Technical indicators like MACD and RSI suggest a bullish reversal in Ethereum’s market trend.
Ethereum, a leading cryptocurrency, has substantially decreased its exchange balance. Since April 2023, over 7 million ETH have been withdrawn. This reduction highlights Ethereum’s growing scarcity. Hence, it also suggests a bullish sentiment in the cryptocurrency market.
Glassnode, an onchain & financial metrics platform, shared insights on X, highlighting the shift in Ethereum’s exchange balance.
The massive withdrawal of Ethereum indicates a surge in investor confidence. Consequently, this trend could significantly impact Ethereum’s market value. Investors are showing a keen interest in holding Ethereum rather than trading it, which could potentially lead to an increase in its price.
Ethereum Current Price Action
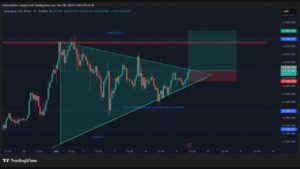
Looking at ETH’s current market price action, ETH is trading on an uptrend as the price resists the downtrend. ETH has been trading in a tight range between $2,200 and $2,300 over the past few days, indicating a period of consolidation. However, today, ETH shows signs of breaking out on the upper side as an uptrend pattern forms on the chart.

ETH/USD price chart: CoinMarket Cap
Since ETH faced resistance at $2,700 following the wide market soar after the spot Bitcoin ETF approval, ETH has been trading below this level. ETH formed a key support at the $2,200 level, which has been holding for a month, and a break below this level could lead to a retrace for the $2,000 key mark for ETH’s uptrend.
Ethereum Technical Outlook
Technical indicators on the daily chart suggest a bullish reversal in ETH’s market as bulls gain momentum. The Moving Average Convergence Divergence (MACD) has shifted from the negative territory as the red bars on the histogram fade away. The MACD line is on the verge of crossing above the signal line, suggesting a rise in buying pressure.

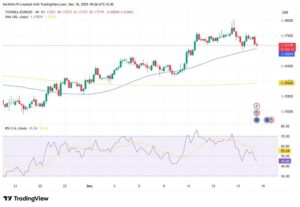
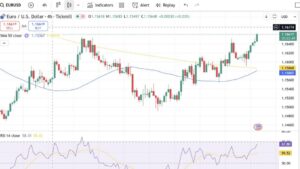
ETH/USD price chart: TradingView
The Relative Strength Index (RSI) is located in the neutral levels at 49, heading upwards. The RSI has been trending below the 50 index since mid-January as the price consolidated at the $2,200 range. However, over the past few days, the RSI has been gaining momentum as it slopes upwards to the overbought region.
In addition, ETH broke above the 50-day Exponential Moving Average, which proved to be a resistance for the bulls a few days ago. However, the 20-day Exponential Moving Average remains an immediate resistance for the bulls to face rejection at this mark. As of this writing, ETH is trading at $2,325, up by 0.91% on the daily timeframe.
The recent plunge in Ethereum’s exchange balance, marked by a significant withdrawal of over 7 million ETH, underscores a possible bullish trend. This development signals ETH’s increasing scarcity and reflects strong investor confidence, potentially influencing its market value positively.


