


Key Insights:
- IntoTheBlock highlights a demand zone around $61,000, suggesting potential support for Bitcoin amidst its ongoing decline.
- Despite ongoing losses, the influx of institutional investors signals potential stabilization and upward momentum for Bitcoin’s price.
- Bitcoin’s on-chain analysis illuminates pivotal price levels, indicating potential support amidst declines and resistance during upward momentum.
In a continuation of its recent negative trend, Bitcoin, the leading digital asset, experienced a 6% drop today amid the recent rebound above $64k. Over the past week, it saw a significant 12% loss from its peak of $73,800 on March 15. Major coins such as Ethereum and Solana, as well as meme coins like Shiba Inu and Dogecoin, also witnessed losses.
As of this writing, BTC is exchanging hands at $64,723 as the bearish activity decreases, with BTC gaining 2% in the past 1 hour. The bears have been holding the ground tight throughout the day as BTC continued to trend in negative territory in most of today’s session.
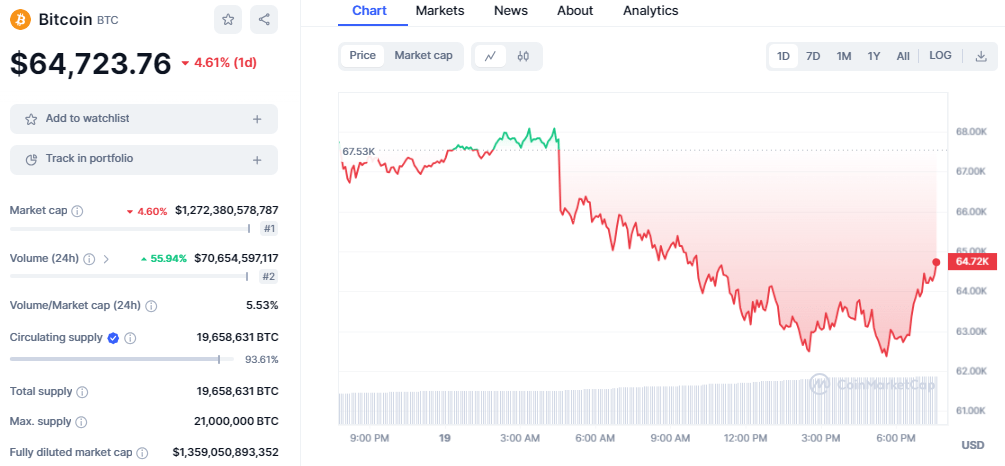
BTC/USD price chart: CoinMarket Cap
Bitcoin’s decline has been consistent, with five out of six days showing red marks. Despite a rebound from its low of $62,428 earlier today, the cryptocurrency’s trading volume surged by 30% over the past week. This increase contrasts with a 0.18% decrease in its circulating supply, which currently stands at 19.65 million, constituting approximately 93.61% of its max supply of 21.00 million. The current market cap for BTC holds at $1.27 trillion, retaining its #1 ranking.
Analyzing the $61k Demand Zone
IntoTheBlock, an on-chain analytics firm, identified a potential demand zone where Bitcoin might find support amidst its ongoing decline. They pointed out that the $61,000 range could serve as a crucial area to monitor. This is supported by the acquisition of over 466,000 BTC by 805,000 addresses at this level, indicating substantial demand.
The significant volume of BTC purchased within this demand zone suggests institutional investors or large players perceive Bitcoin’s current price as attractive for accumulation or undervalued. Such accumulation may lay the groundwork for a price rebound, as higher demand typically correlates with upward price momentum.
Historically, strong demand zones have led to price stabilization and even rallies. Whether this key demand zone will halt Bitcoin’s decline remains uncertain, but the potential for stabilization and a subsequent rebound exists.
Analyst Ali Eye Support and Resistance Zones
Analyzing on-chain data from Glassnode, analyst Ali sheds light on Bitcoin’s support and resistance levels, highlighting crucial price points for potential rebounds or hurdles.
The “UTXO Realized Price Distribution” (URPD) indicator offers insights into the historical purchasing behavior of Bitcoin at various price levels, indicating potential support or resistance zones based on the number of coins held at those levels.
Key findings suggest that $61,100, $56,685, and $51,530 serve as significant support levels, with notable coin acquisition at these prices. Conversely, $66,990 and $72,880 mark substantial resistance levels, indicating strong FOMO buying at all-time highs.
In on-chain analysis, the concentration of coins at specific price levels indicates potential reactions from investors during price retests. A retest from above may prompt accumulation, while a retest from below could trigger selling to break even.
Understanding these dynamics can aid investors in strategizing their actions based on the behavior of holders at different price levels. Bitcoin’s price trajectory hinges on the interplay between these support and resistance levels, shaping market sentiment and influencing trading decisions.
Bitcoin Technical Outlook
Looking at the technical front, Bitcoin displays a bearish outlook as most indicators head to the negative region. The Relative Strength Index (RSI) has dropped to the neutral level, which suggests a decrease in buying pressure, which could drop later toward the oversold region if the current trend holds.
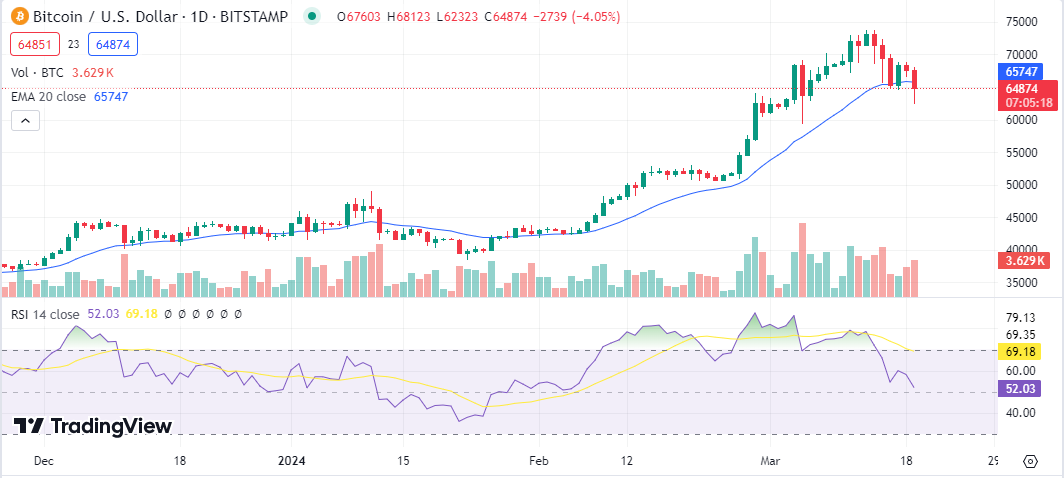
BTC/USD chart: TradingView
In addition, BTC has dropped below the 20-day Exponential Moving Average, which currently indicates a sell signal. The MACD indicator has lost its robust bullish momentum as the green bars on the histogram fade away, suggesting a shift or trend reversal that could lead to more losses if the selling pressure increases.


