As we venture into the dynamic world of forex trading, grasping the visual language of forex charts becomes an essential skill set. Chart formations hold the key to unraveling the market’s direction as they are a roadmap to anticipate potential price fluctuations with notable precision. Among these formations, reversal chart patterns command the spotlight and serve as a reliable instrument for traders to unearth prospective opportunities in the market.
Reversal patterns appear in an assortment of guises, each demonstrating a shift in market sentiment and a plausible shifting in the trend’s trajectory. They embody a transitional phase wherein the impetus behind the market’s previous direction loses its vigor and pivots in the opposite direction.
When a reversal pattern materializes amidst an uptrend, it serves as an indicator of an upcoming downtrend, suggesting that prices are likely to descend in the near future. Conversely, when a reversal pattern emerges during a downtrend, it signifies that the market is gathering strength to ascend, implying an impending bullish price trajectory.
In this article, we will uncover four prominent reversal patterns that hold immense value for traders seeking to enhance their knowledge and trading potential. By familiarizing themselves with these patterns, traders can gain a deeper understanding of market trends and seize advantageous opportunities.
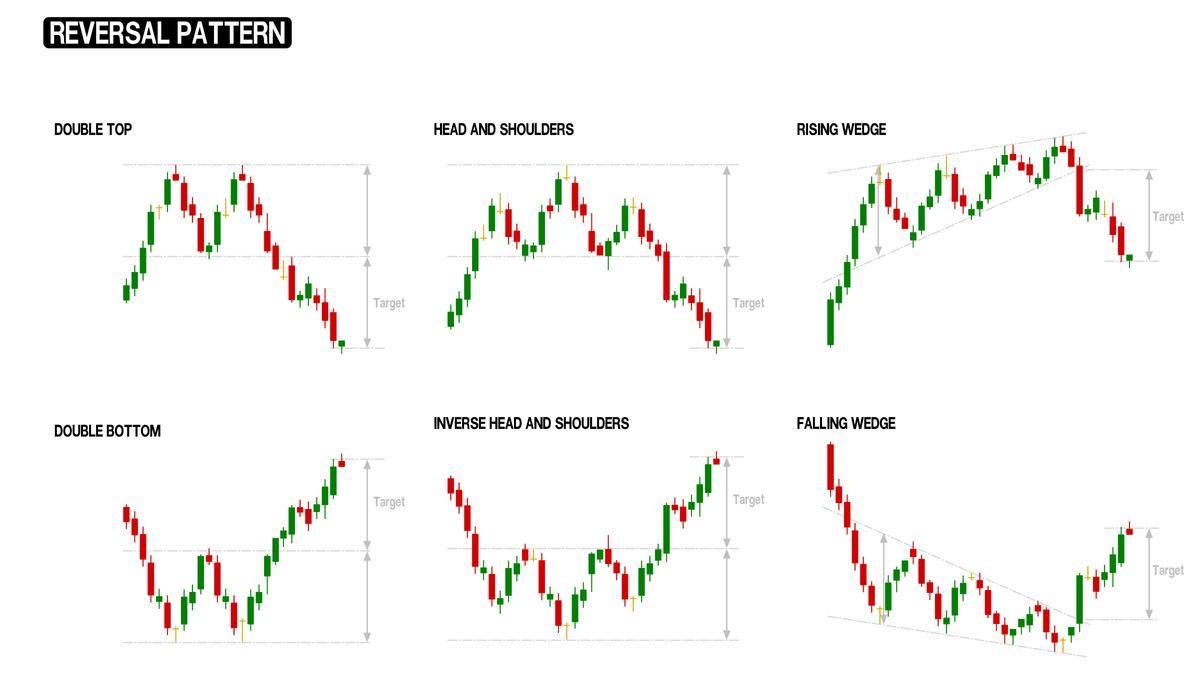
1. Head and shoulders
The Head & Shoulders pattern stands out as one of the most influential reversal patterns within the forex market. This distinct pattern derives its name from its striking resemblance to a head with two shoulders positioned on either side. Typically, the two peaks flanking the pattern exhibit a comparable height or closely approximate each other, while the central peak attains the highest point.
The formation of straight Head & Shoulders typically unfolds amid a bullish trend. Initially, the price surges to create a peak, known as the left shoulder. Following a subsequent technical correction, the price rallies once again, surpassing the previous peak to establish the highest peak (head) of the pattern. Finally, the price retraces back to approximately the same level as the left shoulder and constitutes the right shoulder of the pattern. The line connecting the three bottoms of the peaks is termed the “Neckline.”
Conversely, an inverse Head & Shoulders pattern emerges after a downtrend. In this scenario, the pattern is reversed with an inverted head and two upside-down shoulders. While the inverse Head & Shoulders pattern operates on similar principles as its regular counterpart, the direction of the trend and breakout differ from the regular Head & Shoulders pattern.
The confirmation of the pattern occurs when the price breaches the Neckline. The breakout below or above the Neckline suggests a potential shift in the prevailing trend – bearish reversal in case of an ongoing bullish trend and bullish reversal in case of an existing bearish trend.
2. Double/triple tops and bottoms
Double/Triple top pattern furnishes when an asset’s price hits the same high point two or three times, respectively. This suggests that the current upward trend might reverse as buyers are running out of strength. The confirmation occurs when the price drops below the lowest point between the peaks.
On the other hand, the Double/Triple bottom formation is the reverse of the above pattern. Here, the price of an asset hits the same low point two or three times, respectively, indicating the current downward trend might reverse as sellers are losing power. The trading signal is confirmed when the price breaks above the highest point between the bottoms.
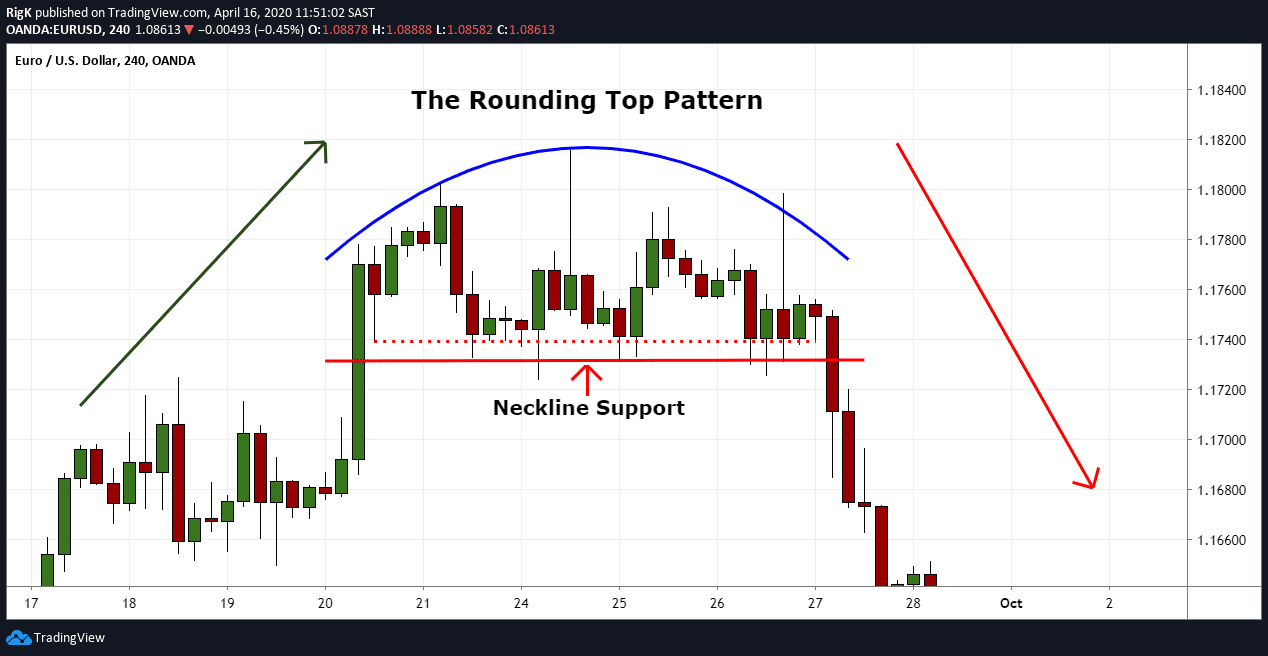
3. Rounding bottom and top
The Rounding Top and Bottom patterns are two commonly identified formations in technical analysis, which traders use to anticipate and react to possible reversals in the prevailing price trends.
Also known as an “inverse saucer,” the rounding top pattern materializes in an inverted ‘U’ shape on the price chart. This pattern begins to form when prices are on an uptrend, indicating bullish market conditions. Gradually, the price increase decelerates and creates an initial curving aspect of the pattern, followed by sideways movement. Finally, the price starts to decline, mirroring the initial increase but in the opposite direction, completing the roundtop formation.
The emergence of this pattern signals the end of an uptrend, suggesting that bulls are losing control. It is often taken as a bearish reversal signal, indicating the potential beginning of a downtrend.
Conversely, the rounding bottom pattern, also known as a “saucer,” appears as an erect ‘U’ shape on the price chart. It typically forms after a sustained downtrend as the rate of price decline gradually slows down. Following this, a period of consolidation ensues, during which prices move sideways. Ultimately, the price begins to ascend, and the rounded bottom pattern is completed.
The formation of a rounded bottom implies the end of a downtrend, exhibiting a bullish reversal signal. This presents traders with an opportunity to enter a long position, banking on the expectation of rising prices.
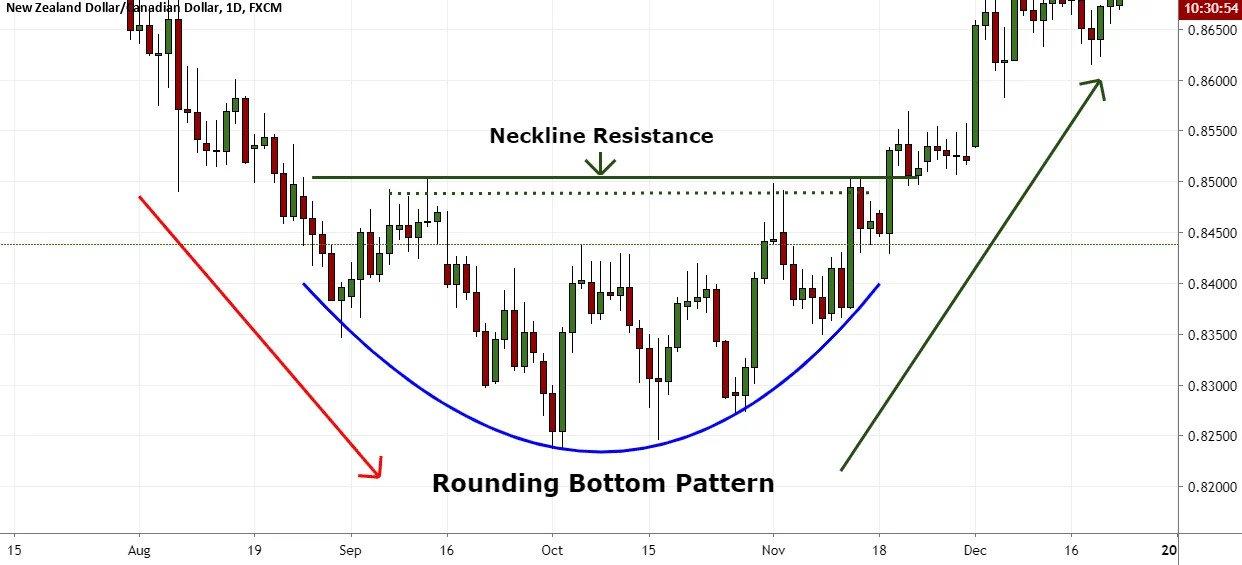
Both patterns, due to their slow and subtle formations, require patience and careful examination from traders.
4. V-shaped (spike) reversal pattern
The V (spike) reversal formation emerges as a technical configuration frequently observed within financial markets.
It usually manifests subsequent to a notable and swift price trend in one direction. This pattern is characterized by its abrupt reversal, wherein prices unexpectedly veer in the opposite direction without providing any overt indications. Note that the name of this formation is derived from its V-shaped appearance on the price chart.
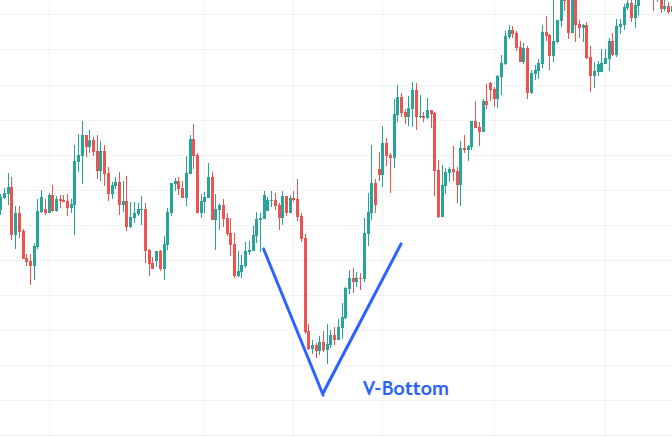
The “V-bottom” is characterized by a sharp price decline followed by a strong rebound, creating a V shape on the chart, signaling a potential bullish reversal.
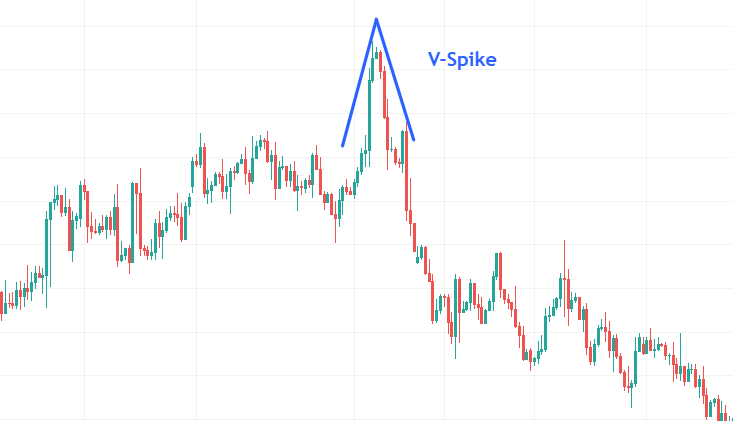
Conversely, the “V-top” pattern depicts a rapid price rise followed by a swift fall, forming an inverted V spike, suggesting a possible bearish reversal.
The “sudden” nature of this reversal makes it considerably complex when it comes to trading, as there are generally no readily apparent cues to signify the impending reversal in price.
Considering the capricious and rapid nature of these reversals, it is often advised that participants exercise caution and proceed with a plan when they trade a V reversal pattern.
Read more:
https://thetradingbay.com/10-most-powerful-reversal-candlestick-patterns/