


Technical indicators act as navigational compasses for market explorers, unveiling the rhythmic ballet of supply and demand that shapes the worth of financial assets. Rooted in the principles of technical analysis, these indicators draw upon historical price data to predict the future trajectory of a financial instrument. By spotlighting patterns and trends, they provide traders with a clearer understanding of how current prices relate to past movements, paving the way for more informed trading decisions.
In this article, we will discuss the top 5 technical indicators that are crucial for optimizing your trading strategies. By understanding and effectively utilizing these tools, you can gain a deeper insight into market trends and better predict potential price movements in an ever-changing financial landscape.
1. Moving Average
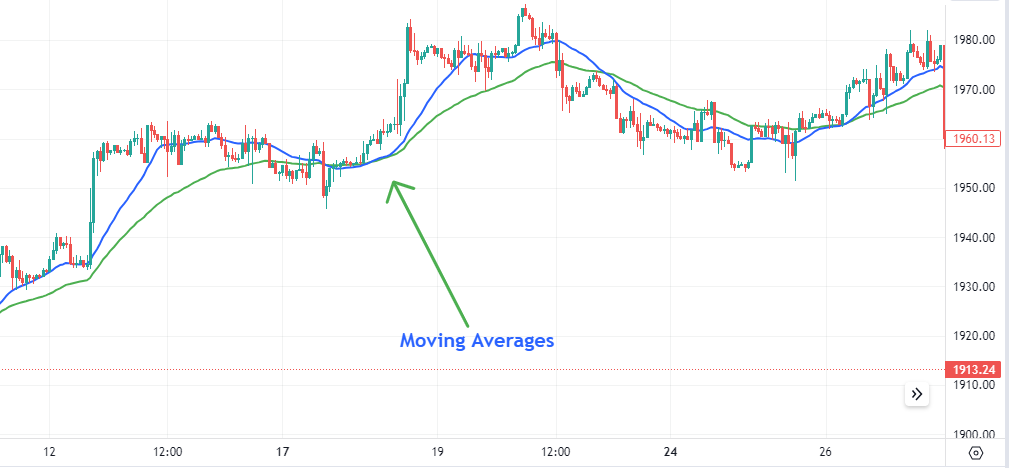
The moving average is a tool used in technical analysis to smooth out price data and produce a consistent indicator. It essentially provides a clearer view of the price trend over a specific period of time. The moving average is categorized as an overlay indicator since it is plotted on the same chart as the price.
How does it work?
The moving average works by averaging a set number of historical price points. As time progresses, the oldest price point is dropped and the newest is added, thus “moving” the average.
Types of Moving Averages:
- Simple Moving Average (SMA): This is the average of a selected range of prices, typically closing prices, over a specific number of periods, such as days. For instance, a 50-day SMA will average the closing prices of the last 50 days.
- Exponential Moving Average (EMA): Unlike the SMA, the EMA gives more weight to the most recent prices, making it more responsive to recent price changes. This responsiveness makes the EMA more suitable for those traders who want an indicator that reacts more quickly to recent price actions.
Applications:
Identifying Trend Direction: Both the SMA and EMA help traders decipher the general trend direction of the market. This identification can be especially useful in filtering out the noise from daily price fluctuations.
Crossovers: One of the key signals to watch with moving averages is the crossover. If a short-term moving average surpasses a long-term moving average, it suggests an upcoming upward trend. This is known as a “bullish crossover.” Conversely, if a short-term moving average dips below a long-term one, termed a “bearish crossover,” it might indicate a potential downward trend.
Trend Reversal Level: Another major use of the moving average indicator is identifying trend reversal levels. When prices deviate significantly from their moving average, it might be an indication that the current trend is weakening, potentially signaling a reversal.
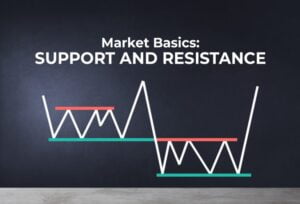
Support and Resistance Levels: Based on historical price movements, moving averages can be used to pinpoint potential areas of support or resistance. When a price approaches its moving average from above and bounces off it, the moving average might act as a support level. Conversely, if the price approaches from below and then drops, the moving average might act as resistance.
2. Relative Strength Index

The Relative Strength Index, or RSI for short, is like a barometer for market momentum. It is a tool, developed by J. Welles Wilder, that helps traders gauge the magnitude of price shifts in assets, be it stocks, currencies, or commodities. Think of RSI as a momentum tracker, letting you peek into how swiftly and drastically prices are moving, giving a hint about the robustness of price trends.
What does RSI tell us?
Overbought and oversold areas: When RSI moves above 70, it is a sign that maybe the asset’s price is valued more than it should be. That is a heads-up that its price might cool down after a bit of time. On the flip side, an RSI diving below 30 hints the market might be undervaluing an asset, making it ripe for a potential uptick in the time ahead.
Divergence: If the asset price and RSI do not move hand in hand (divergence), it’s an important clue for traders. For instance, if the asset’s price is making higher highs, but the RSI is making lower highs, it indicates that the current upward price trend may be losing its steam and could reverse. Divergences often hint at momentum losing its grip.
Support and Resistance Touchpoints: In bullish times, RSI seldom ducks below 30 and can often graze or leap past 70. Here, the 30 mark acts as a safety net, hinting that even if prices wobble, the bullish vibe persists. Conversely, during bearish periods, RSI usually hovers beneath 70 and might dip towards 30 or even lower. In these scenarios, the 70 threshold becomes a ceiling, implying that the market’s bearish mood is still in play.
3. Fibonacci retracement levels
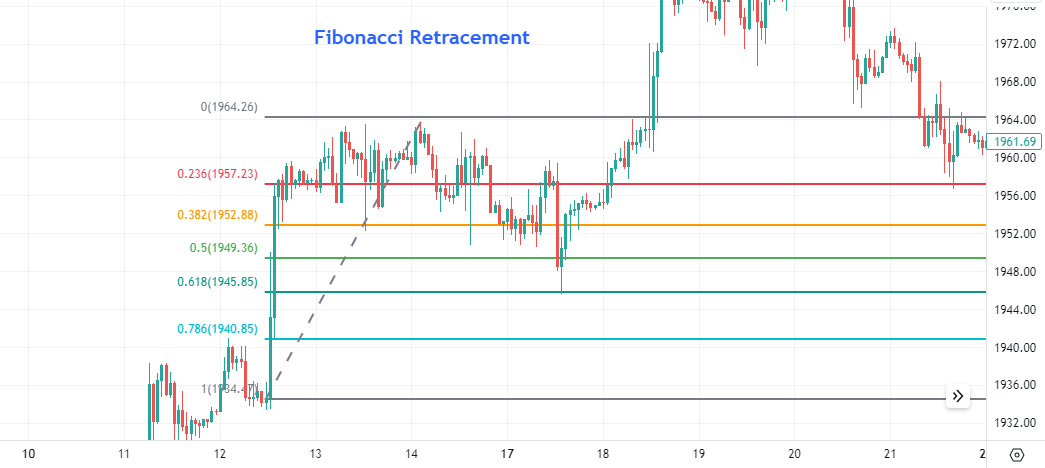
Fibonacci retracement levels are a significant tool in the arsenal of technical analysis. They guide traders in anticipating where price points might conclude the retracement and resume the initial trend.
How to draw Fibonacci:
Fibonacci retracements are plotted from a market peak to the lower end or from the lower dip to the market top. This method uses the Fibonacci sequence, particularly ratios like 61.8%, to segment this range. By marking these calculated percentages, traders pinpoint crucial zones in price action.
Why It Matters?
Hitting a Fibonacci level might suggest the price is ripe for a bounce, reversing in the direction it initially headed. This insight aids in spotting potential buy or sell opportunities.
4. Ichimoku Cloud
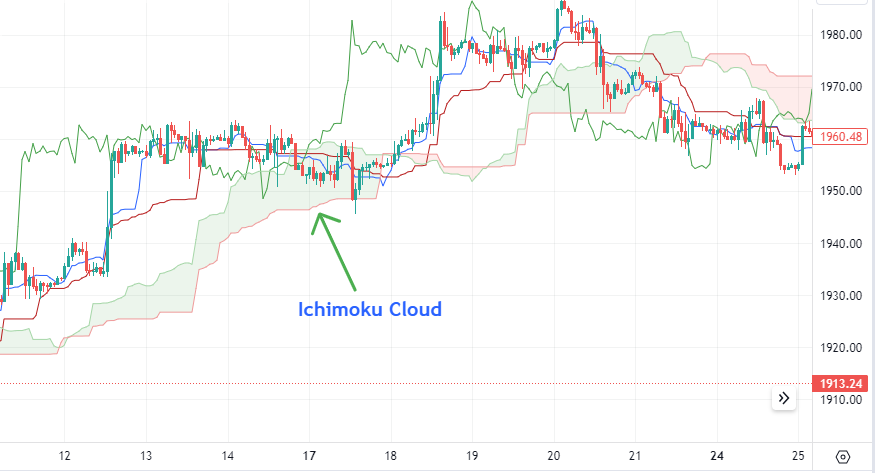
The Ichimoku Cloud, rooted in Goichi Hosoda’s vision, is a leading indicator that amalgamates trend analysis with predictions on price movement. With its unique framework, it encompasses several aspects of technical analysis in one glimpse.
The indicator anatomy:
The Ichimoku Cloud is composed of five lines, which are:
- Tenkan-sen: Averages the 9-period high and low.
- Kijun-sen: Averages the 26-period high and low.
- Chikou Span: Current closing price plotted 26 periods behind.
- Senkou Span A: Midpoint of Tenkan-sen and Kijun-sen plotted 26 periods ahead.
- Senkou Span B: Averages the 52-period high and low, plotted 26 periods forward.
The “cloud” or “kumo” is the space between Senkou Span A and B, highlighting support and resistance zones.
What does Ichimoku Cloud tell us?
The Ichimoku Cloud does not merely measure — it predicts. It offers a comprehensive view of support and resistance, momentum, and trend direction. This integrated perspective, rooted in actual price behaviors, sets it apart in the realm of technical analysis tools.
5. On-Balance Volume Indicator (OBV)
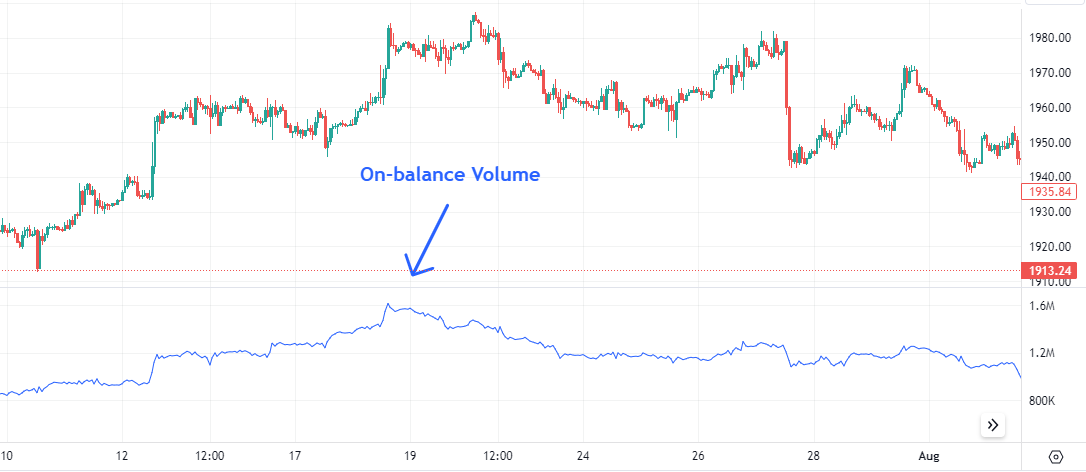
OBV is a crucial tool related to volume, tracking the net trading activity—essentially tallying buying against selling volume over time.
Calculating OBV:
Every trading day’s volume is either added to (for days when prices rise) or subtracted from (for days when prices fall) the cumulative OBV. So, think of it as a running score of who is winning – buyers or sellers.
Implications:
A rising OBV hints at increasing buying interest, while a declining OBV suggests sellers might be taking the upper hand. It is essential to remember that the actual numerical value of OBV isn’t as important as its overall direction.
Why it is important:
OBV is like an early warning system. Before prices shift, OBV might tip traders off about potential changes, acting on the idea that volume movements often come before price changes. This is because it is believed that “smart” traders typically make their moves earlier, and OBV can capture this momentum. When the broader public then jumps in, both the asset’s price and OBV surge.
Read More:
https://thetradingbay.com/4-powerful-reversal-chart-patterns-that-every-trader-must-know


