


Most traders utilize Japanese candlestick charts for market analysis where they place a high focus on candlestick patterns to predict the price direction. As per the shape & formation of candlesticks, forex market participants can judge the prevailing market sentiment.
Here are the 10 most powerful reversal candlestick patterns that suggest an end to the existing trend and indicate an impending price reversal.
1. Hammer

The hammer candle is composed of a small upper body and a long wick on the lower side. It is a bullish candlestick pattern that signals the conclusion of a downtrend, stipulating that the price will now ascend.
The lengthy lower shadow signifies that the sellers pushed the price downward but the buying pressure subdued the bears, causing the price to close at the open with a long wick.
Here are a few conditions to recognize the hammer:
- The wick should be two or three times longer than the body.
- The color of the candle’s body is not important.
- There should be little or no upper wick.
2. Hanging man
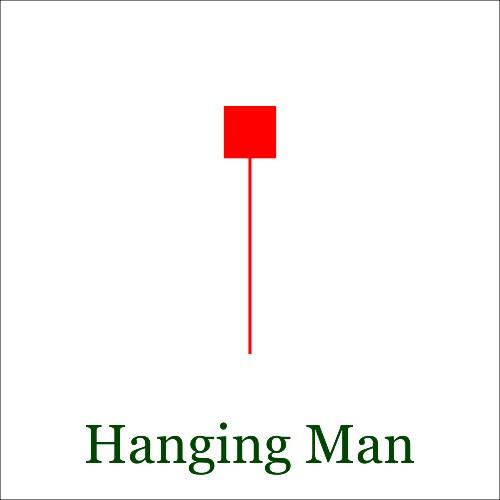
Like the hammer, the hanging man also consists of a small upper body and a long lower shadow. However, it is a bearish candlestick pattern and forms at the potential end or top of an upward trend, suggesting a price reversal on the downside.
The hanging man indicates that sellers are beginning to take control of the market and bulls are losing their momentum.
The criteria for recognizing a hanging man is similar to a hammer, except that a red body provides a stronger reversal signal than the green one.
3. Three white soldiers
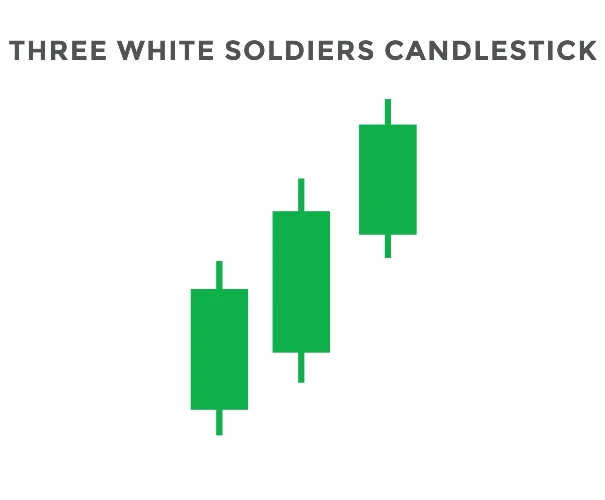
Three white soldiers is one of the strongest reversal candlestick patterns characterized by three rising bullish candles. The candles appear after a bearish rally, confirming a potential reversal to the upside.
Here are two conditions for the pattern to be deemed valid:
- The second candlestick should be bigger than the first candle of the formation.
- The final candlestick must be equal to or larger than the second candle with little or no wick.
4. Three black crows
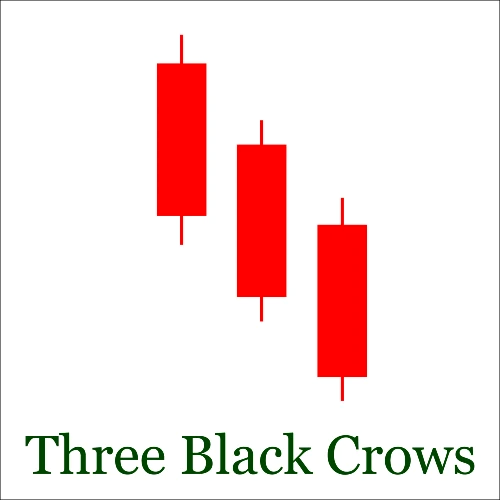
Three black crows is the bearish variation of three white soldiers. This reversal pattern appears during an upside trend, signaling a potential turn toward the downside. The formation signifies that the bears have now overtaken the market after a period of bullish dominance.
For a three black crows pattern to be considered valid, the second candle’s body should be larger than the first and the third candle must be at least of similar size to the previous candle.
5. Tweezer top
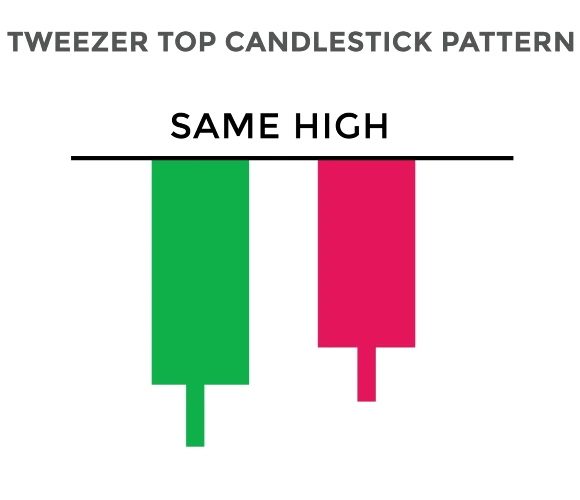
Tweezer top is a dual candlestick pattern that forms at the top of uptrends and implies a bearish reversal. It consists of two candles with equal-level tops, whether they are wicks or candle bodies.
You can identify the tweezer top as per these criteria:
- A proper upward trend should be present before the appearance of the pattern.
- The two candles must appear consecutive and touch the exact same height.
- While the color of the candle’s body is not much important, it is better for the first candle to be green (bullish) and the second one red (bearish).
6. Tweezer bottom

Tweezer bottom is one of the most prominent bullish candlestick patterns that signal the end of a downtrend, signifying a potential bounce to the upside. Its structure includes two candlesticks with matching bottoms, consisting of either equal-level wicks or bodies.
The identification criteria for the tweezer bottom is the same as for the tweezer top except that it’s better for the first candle to be red here & the second candlestick to be green.
7. Morning star

Extremely popular among the reversal candlestick patterns, the morning star is a triple candlestick formation that demonstrates a likely conclusion of downtrend & signifies a bullish trend reversal.
It consists of three candles: the first one (red candle) is an extension of the original bearish trend, the middle one is a small-bodied star or doji candlestick, and the third candle must be a bullish (green) candle closing at or above the mid-level of the first candle.
In the morning star pattern, the first candle stipulates that sellers were dominating the market while the second candle shows the competition between sellers and buyers. The final candle exhibits that the buyers successfully took control of the market.
8. Evening star

Evening start is the bearish counterpart of morning star; it appears following an uptrend and indicates a potential reversal to the downside. Here’s how you can identify an evening star pattern.
- The pattern includes three candles: the first candlestick is a strong bullish candle belonging to the prevailing trend.
- The second candlestick has a small body, like a doji or spinning top, showing the market’s indecision. It can be either red or green.
- There is a gap between the second and the first candle – the second candle can also form within the shadow of the first candle.
- The third candle is bearish and it must close below the mid-point of the first candle.
9. Bullish engulfing
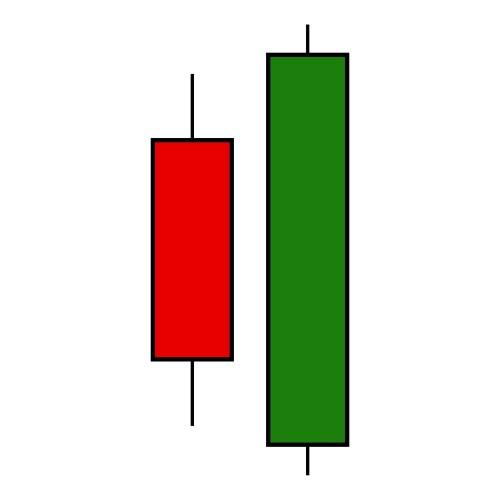
Bullish engulfing is one of the simplest reversal candlestick patterns where a relatively smaller red candle is “engulfed” by the next large green candle.
It is a dual candlestick pattern that forms during a downtrend and signals a potential bullish reversal. The pattern includes a green candle (second one) that is much larger than the previous bearish candle, meaning the bull completely overshadows the bear.
10. Bearish engulfing (Reversal Candlestick Patterns)

Bearish engulfing is a dual candlestick pattern that usually appears at the top of an uptrend, stipulating the start of a potential move toward the downside. The pattern is characterized by a green candle and a large red candle that engulfs the former from both the upside & downside.
You may also like:


