


As per technical analysis, price moves in repeatable patterns and all the necessary information is incorporated in the market graphs themselves. Forex chart patterns are a central component of this technical analysis strategy as they manifest the underlying price action and market dynamics. These patterns stipulate a specific price sequence or trajectory, which forex traders study to speculate the future price direction.
Here is a list of the most commonly occurring and best forex chart patterns that every trader must know to take advantage of the emerging trade opportunities.
10 Best Forex Chart Patterns
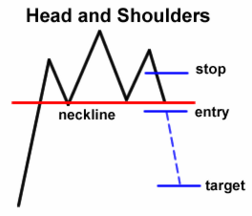
1. Head & Shoulders
An upright head and shoulders formation is one of the most popular forex chart patterns, which signifies the reversal of the prevailing bullish trend into a bearish direction. This graphic pattern consists of three peaks, with the middle peak (head) being the highest compared to the first and third swing highs (shoulders) of almost equal length. Traders can enter a sell trade in case the price breaks below the “neckline level”, joining the two shoulders.
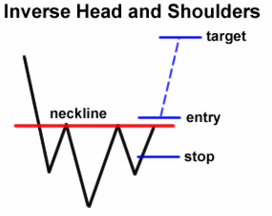
On the other hand, an inverted head and shoulders pattern (three swing lows) appears at the end of a downtrend and signals a bullish reversal.
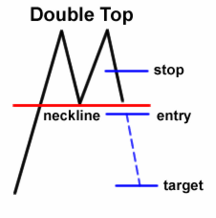
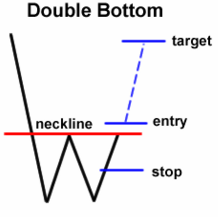
2. Double top and bottom
Double top and double bottom are also reversal sequences that indicate a change in the ongoing market trend. A double top pattern consists of two swing highs of equal or slightly uneven lengths that are rejected from a resistance zone, implying the weakness of buyers. A bearish reversal becomes apparent when the price breaks the lower support line after facing off two top rejections.
Oppositely, double bottoms specify that the sellers cannot push the price down further, signalling a bullish reversal.
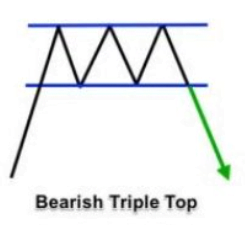
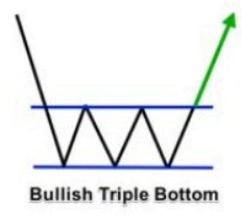
3. Triple top and bottom
The triple top and bottom pattern is a variation of the double top and bottom formation, indicating a trend reversal. The only difference is that in this pattern, price rejection occurs three times from the resistance or support levels instead of two times. Triple tops appear at the termination of an upward trend and point towards a potential bearish reversal. In contrast, triple bottoms can be identified at the end of a downward price trend and signal a bullish reversal.
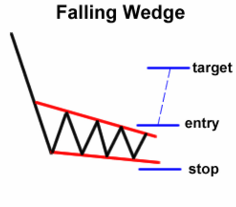
4. Ascending and Descending Wedges
A wedge pattern forms when the price is consolidated between two converging support and resistance lines. Though a rising or ascending wedge can develop during both market directions (upward and downward), it always stipulates a bearish breakout, making it a continuation as well as a reversal pattern accordingly.
In contrast, a falling or descending wedge hints at a potential bullish breakout, regardless of the preceding market trajectory.

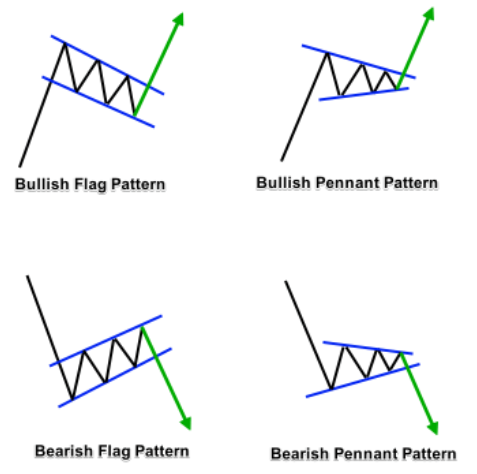
5. Flags or pennants
Flags and pennants are known as continuation formations, where a flag pattern consists of two parallel trend lines, whereas a pennant is composed of two converging lines meeting at a single point. A down sloping flag or pennant appears during an upward trend, indicating a short-consolidation phase before the trend could resume. Traders can enter a “buy” trade when the price breaks out from the upper resistance line.
Conversely, an upslope pennant or flag is formed after a sharp bearish price move, demonstrating a price consolidation period. Traders prefer a “sell” entry if a breakout from the lower support zone occurs.
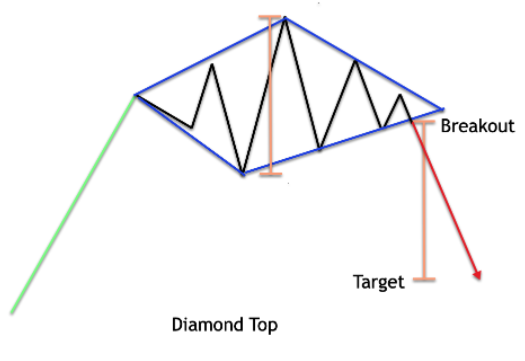
6. Diamond pattern
A diamond pattern is an advanced reversal pattern in which the price settles in the shape of a diamond. When established at the termination of a bullish trend, it is named “diamond top”, whereas when it appears at the end of a bearish move, it is termed “diamond bottom.”
This pattern can be identified by drawing four trendlines: two on the upper section and two on the lower segment. The upper part of the diamond consists of one trendline from the lowest left shoulder point to the head and a second trendline from the head to the lowest level of the right shoulder. Similarly, the bottom section can be completed by drawing trendlines from the lowest swing low to the left and right shoulders. Traders can enter the “buy” or “sell” trades if the price breaks out from the completed structure.
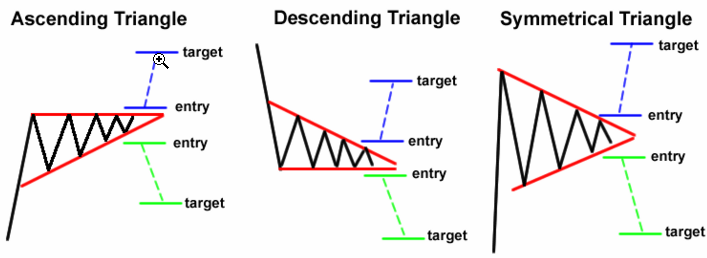
7. Triangles
Triangular patterns are usually presented in three basic forms: symmetrical, ascending, and descending. The symmetrical triangle is formed when the price continues to move in a sideways rally and trendlines converge at one point. Ascending and descending triangles are also the same, except that they incorporate a flat upper trend line and flat lower trend line, respectively.
The symmetrical triangle is a “neutral” formation from which price can break out in either direction. Moreover, it can appear during both upward and downward price trends. On the other hand, an ascending triangle indicates a bullish trend continuation while a descending triangle points towards the bearish trend resumption.
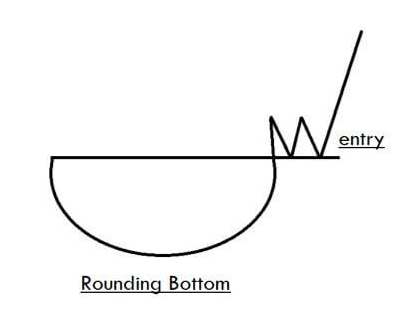
8. Round top or bottom
A rounding top is a reversal pattern that represents a progressive market shift from the bullish bias to a selling sentiment, forming a semicircle shape. Traders can take a “sell” position when the price breaks the area’s support line.
Conversely, the round price bottom forms at the conclusion of a downtrend, identifying a potential bullish reversal.

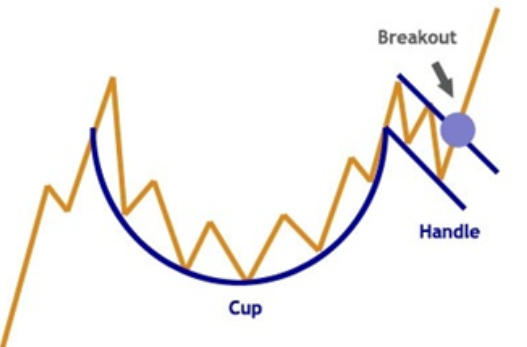
9. Cup and handle
Cup and handle is a widely recognized continuation pattern composed of a rounding top or bottom with an additional price pullback. When this formation emerges during an upward trend, it indicates that the sellers failed to take over the market, and the current bullish market direction would most likely continue.
On the other hand, an inverse cup and handle can materialize during a bearish trend, providing a “sell” opportunity to the market participants on the breakout below the support line.
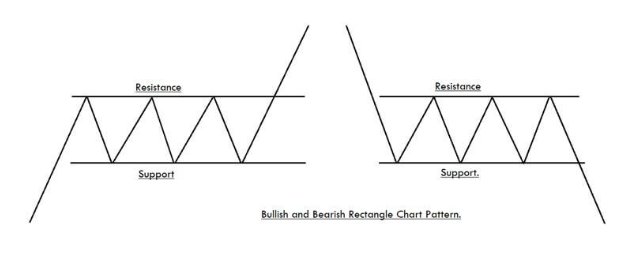
10. Rectangles
A rectangular pattern is another prominent forex chart pattern that indicates a continuance of the present trend. It appears on the chart when the price moves sideways in a parallel channel, forming the shape of a “rectangle”.
In the case of a bullish rectangle, traders can enter a buy trade when the price breaks out above the resistance line. Contrarily, if the rectangle formation appears during a downtrend, traders can enter a “sell” trade when the price breaches the lower support zone.
You may also like:
- What is Forex Trading and How Does it Work? – 5 Easy to Follow Steps
- Forex Risk Management: How to Manage Risk in Forex?
Conclusion
There are so many things to learn in forex trading but mastering the basics is like the foundation of a big house. If you miss the basics, you can kiss your dreams of making millions in Forex trading goodbye. Investing success depends on choosing carefully and then putting enough time and effort into understanding how to use these best Forex chart patterns!


