


Foreign exchange trading has become a leading sensation among global financial enthusiasts who aim to capitalize on this lucrative sphere. Traders strive to grab profitable opportunities from the dynamic forex market via various strategies and trading plans.
That said, price action trading is one of the simplest yet effective trading approaches utilized by most market participants. As the foundation of technical analysis, pure price action delivers clear trading signals without the involvement of much complexity.
If you want to learn about price action trading, here we have explained what exactly is price action trading and its basics, as well as the most productive strategies based on price action.
What is price action trading?
Price action refers to a technique where traders only analyze the ‘price data’ of security to predict its next direction. When the buyers and sellers actively interact at a specific market forum, numerous chart patterns frequently emerge over time. The price action traders focus solely on these price formations, mainly candlesticks and pivot points, to place trade orders. Simply put, instead of utilizing lagging indicators, price action traders primarily base their trading decisions on the historical price movement of financial markets.
The importance of price action can be highlighted by the fact that all the technical indicators and advanced trading systems basically stem from the price data. Originally, the market only exhibits the ‘pricing information’ of relevant securities, making price itself the most reliable indicator.
Basics of price action trading strategy
Let us look at some of the primary tools that play a key role in price action-based strategies.
Candlesticks – individual candles and chart patterns
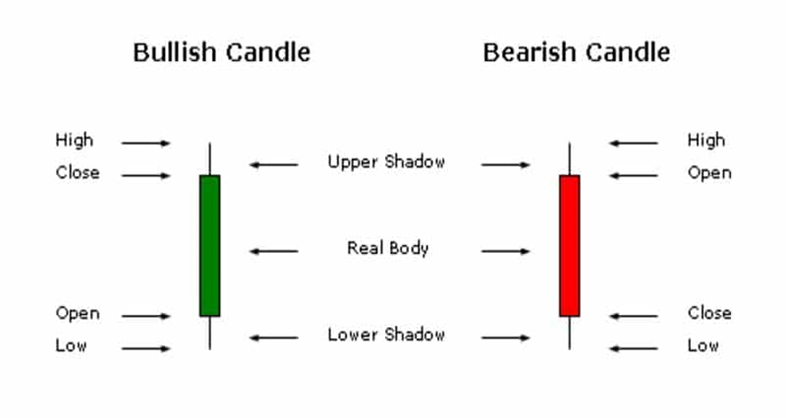
Candlestick graphs relay significant information about the opening and closing prices of assets over a specific period. A candle is composed of “body” and “ two wicks” that protrude each from an upper & lower side of the body. While the body represents the opening and closing price points, the edges of wicks stipulate the highest and lowest price levels reached during the selected time range (e.g., one hour).
Besides speculating market direction from the anatomy of ‘single’ candles, price action traders also count on multiple-candle patterns, like head and shoulders or double/triple bottoms.
Support and resistance
Support and resistance zones are known as the key areas where the buying and selling pressure increases, respectively. Traders tend to look for sell opportunities at a supply level (resistance) if the market respects that area. Contrarily, at the demand level (support), buyers enter the market and propel the price upwards in conformity with the previous demand pressure.
Trends and consolidation
When the price is consistently moving upwards or downwards, it is said to be “trending.” Whereas the market phase in which the price has no clear direction and ranges at a fixed zone is termed “consolidation.”
The bullish or bearish trends and flat market perpetuate several positive opportunities to price action traders.
Four best price action trading strategies
Here are some proven price action strategies that you can practice and apply if they suit your trading style.
1. Price rejection from support/resistance
Trading from support and resistance is a time-tested technique that offers relatively viable results. You can enter a trade when the price “springs” from a pivot level – the area price rejected previously, either one, two, or many times.
As per this price action strategy, traders keep the support/demand zone on their radars for placing buy orders. Conversely, sellers enter the market when the price maintains a resistance/supply level. Note that, in both cases, the rejection can also occur 2%-3% before or after the exact belt as trading setups mostly do not follow strict conditions.
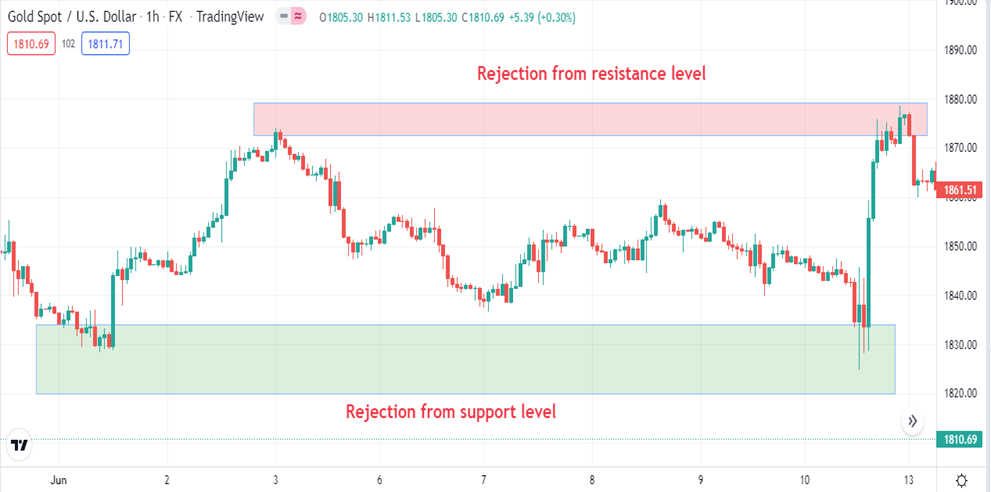
In the above Gold Spot/USD chart, see how the price climbed up from the support level of 1825-1830. Similarly, the price could not breach the 1875-1880 resistance zone and turned downwards under the selling pressure.
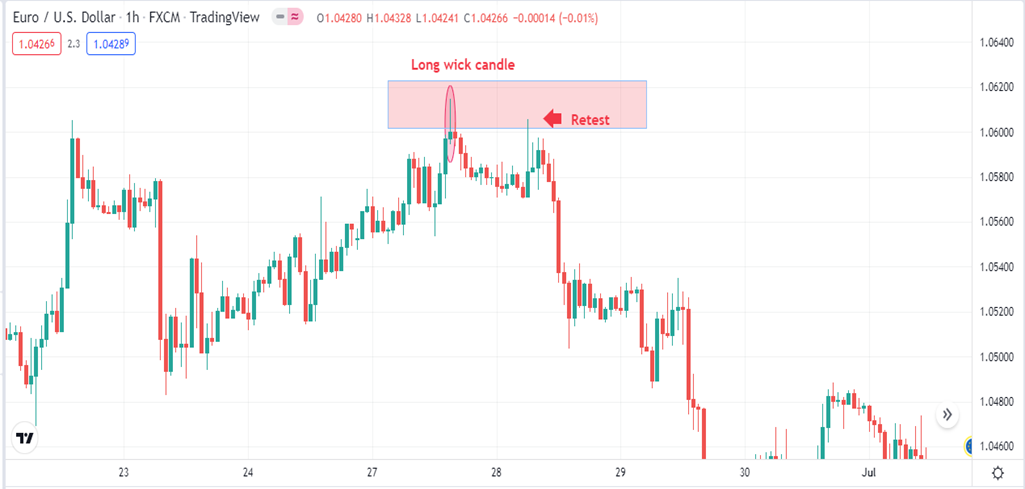
2. Long wick candles (hammer and shooting star)
Long wick candles, also known as pin bars, hammers, and shooting stars, with a reliable retest, indicate one of the best reversal trading setups. Generally, a hammer forms at the conclusion of a downtrend when the buyers start overtaking the market.
In contrast, a shooting star appears at the top of a bullish channel when the buyers fail to thrust the price further upwards. The weak push by buyers is immediately overtaken by sellers, resulting in the retreating of the candle body downside. In the EUR/USD chart below, a long wick candle is successfully retested, hence confirming the end of buying pressure.
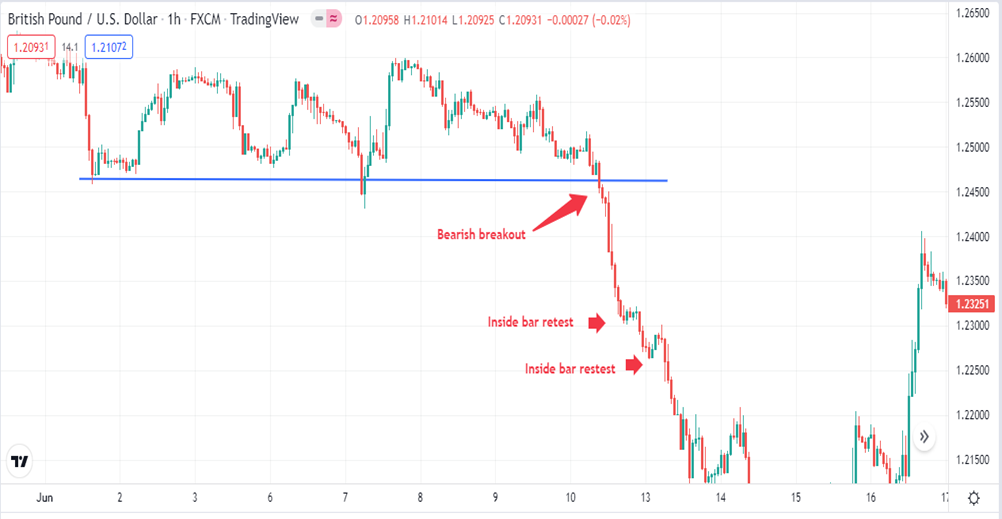
3. Breakout with inside bars retest
Inside bars are usually two or three opposite-direction small candles that appear between the recent swing areas. Inside bars after a breakout signify the validity of a breakout as the pull-back candles are relatively weak. Note that these bars can also appear before a breakout, stipulating an increased probability of the imminent breakout.
In the GBP/USD chart below, you can notice that the price makes a clear breakout in the bearish direction. Two inside bars retest can be seen along the way, indicating that the selling push is likely to continue.
4. Trend trading
Trend trending is one of the simplest and most proficient trading techniques. By overviewing a chart, you can determine whether the price waves are moving upwards or downwards. During a bearish trend, the price proceeds downwards with lower lows and lower highs. Traders can place a sell trade on each pull-back to grasp better entry points.
In a bullish trend, the price forms higher highs and higher lows, respecting the dynamic support level. Further, in most cases, the price slightly retraces in the opposite direction or creates sloping pennants/flags patterns, only to continue in the trend direction.
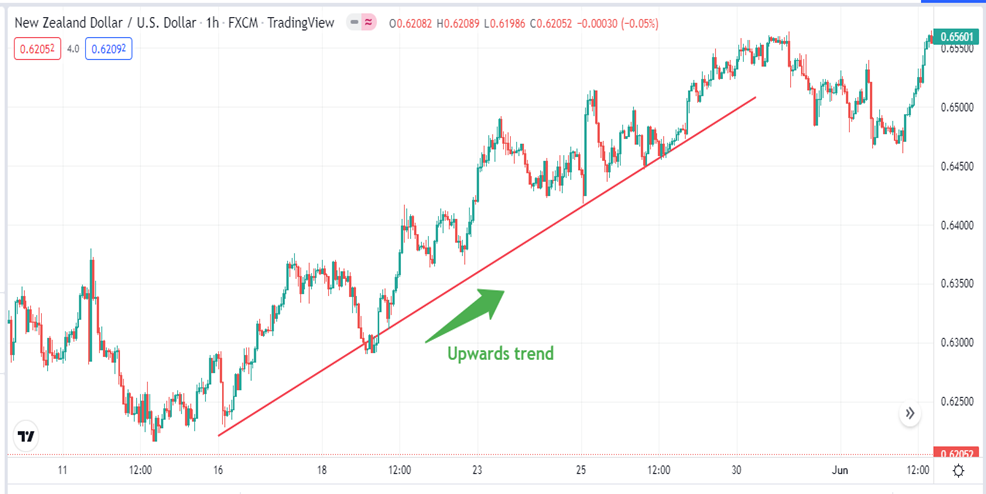
The above NZD/USD chart displays a bullish trend where the price bounces from an upslope support level and makes higher highs.
Closing thoughts
Although price action trading is acclaimed as one of the most profitable methods, it still depends on how efficiently you apply it. For instance, you must also consider fundamental factors and work on your discipline or steadiness while trading to achieve optimal results. Moreover, never forget to take help from some best price action trading books and courses to level up your skills, as there is always room for improvement!
Read more:
https://thetradingbay.com/what-is-forex-trading-and-how-does-it-work/


