


Amid the turbulent and dynamic financial markets, traders adopt a variety of analytical strategies or techniques to stay ahead of others. While technical analysts utilize many indicators to build efficient trading systems, moving average (MA) has the distinction of being the most versatile and simplest technical indicator that complements most setups.
As a lagging indicator, MAs may appear too simplistic and useless; however, that is not the case. They can indicate multiple value areas, trending channels, and reversal points as prices frequently respect the moving average levels, hence offering various good trade opportunities.
Here we have discussed what exactly moving averages are, their common types, and four time-tested moving average methods for successful trading.
What is a moving average?
Moving average is a technical indicator that integrates the price data of specific days, enacting a dynamic average line plotted on the price graph. Traders mainly use this indicator to identify trend directions and support/resistance levels as it minimizes the noise from constant price fluctuations.
Technically, moving average is calculated by taking the arithmetic mean of a data point set (the data is price information in the case of financial securities) over a definite period of time. The moving average’s time length is customizable, and traders can select any duration, such as 50, 100, or 200 days, that matches best with their trading strategy.
Note that the shorter span moving averages are more sensitive to the price movements compared to longer-span averages. Higher length averages, like the 200-period, are also more lagging relative to the shorter periods.
Types of moving averages explained – SMA and EMA
Here is a brief explanation of the two types of moving averages:
1. Simple Moving Average (SMA)
As the name suggests, Simple Moving Average is the most basic form of moving average computed by the standard mean formula. For example, a 50-period SMA sums up the 50 most recent closing prices and divides the result by 50, calculating a new average each day.
2. Exponential Moving Average (EMA)
An exponential moving average is a unique modification that confers more weightage to the recent price information compared to the previous data points over a specific period. This weight-based formula makes EMA remarkably responsive to the latest price changes relative to SMA, which gives equal weight to all prices.
If you apply the same period SMA and EMA on a price chart, you will notice that the EMA experiences more fluctuations and sensitivity than the SMA due to its enhanced focus on recent data.
Top 3 moving average methods for profitable trading
Now that we have understood what moving averages are let us look at the best 4 moving average methods that can augment your trading outcomes. We have utilized the exponential moving average in these strategies, as it offers more sharp and reactive setups.
1. Ride the trend with a moving average
While theoretically, we describe ‘market trends’ in a clean-cut way, financial markets mostly divulge from such fixed rules. For instance, bullish trends are defined by higher highs and higher lows, whereas bearish trends are marked by lower highs and lower lows. But in reality, most of the times, trends experience complex pullbacks or erratic movements as opposed to their stamped definition.
Moving averages allow one to ride the trend waves without getting confused by such occasional jolts. It is the easiest moving average method as you can join a trend as long as the price remains below or above the dynamic line.
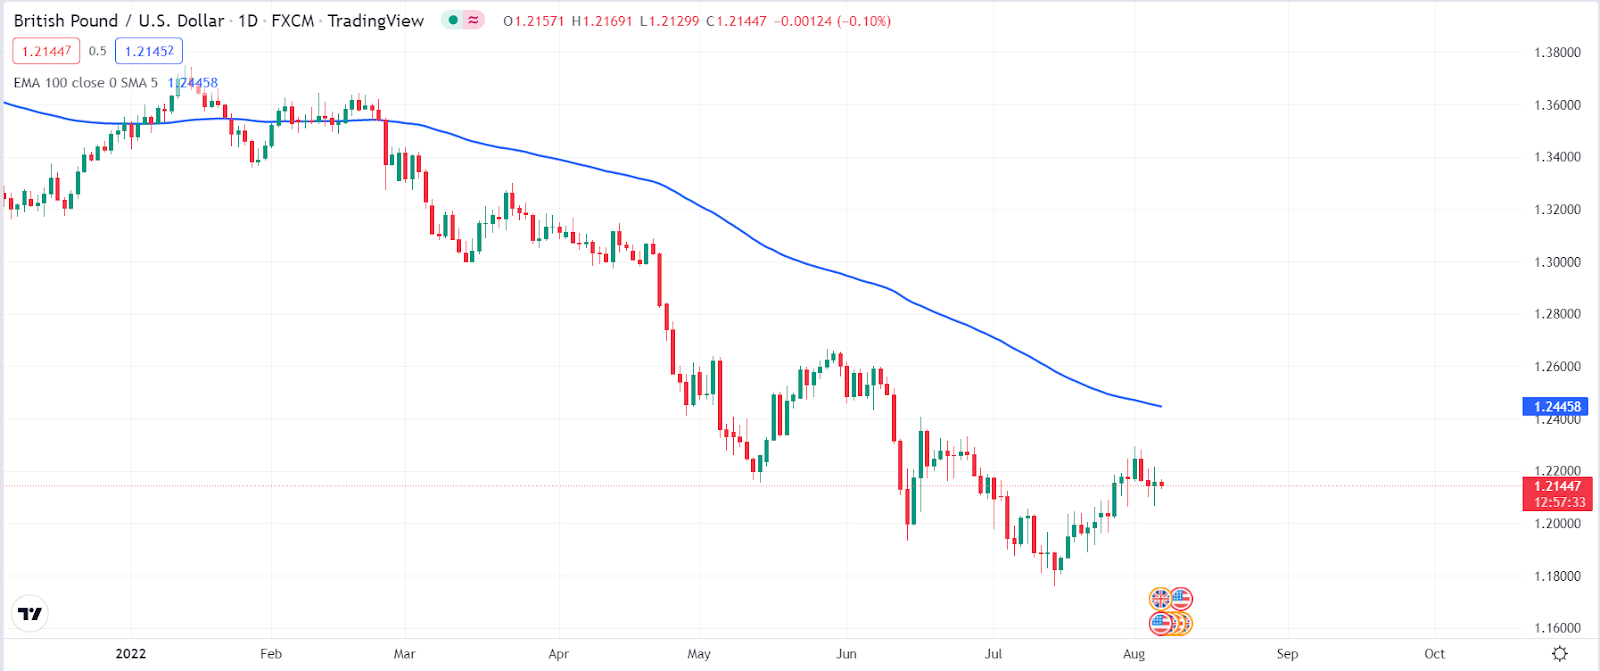
In the below GBP/USD 1-D chart, you can identify that the price is moving significantly below the plotted 100-EMA. Consequently, the setup offers sell opportunities irrespective of the “shape of the price channel.” Traders can grab bearish positions till the price does not cross above the exponential moving average.
Note that we have applied this strategy on a 1-day chart to avoid market noise, and the mentioned trend goes on for months. Simply put, it is a stress-free and highly lucrative strategy suitable for swing traders.
2. Bounce from moving averages within a trend (Support and Resistance)
Besides denoting the trend angle, moving averages also act as moveable support and resistance lines. While the market is proceeding in a trend, these moving lines offer good trade entry points on every price rejection.
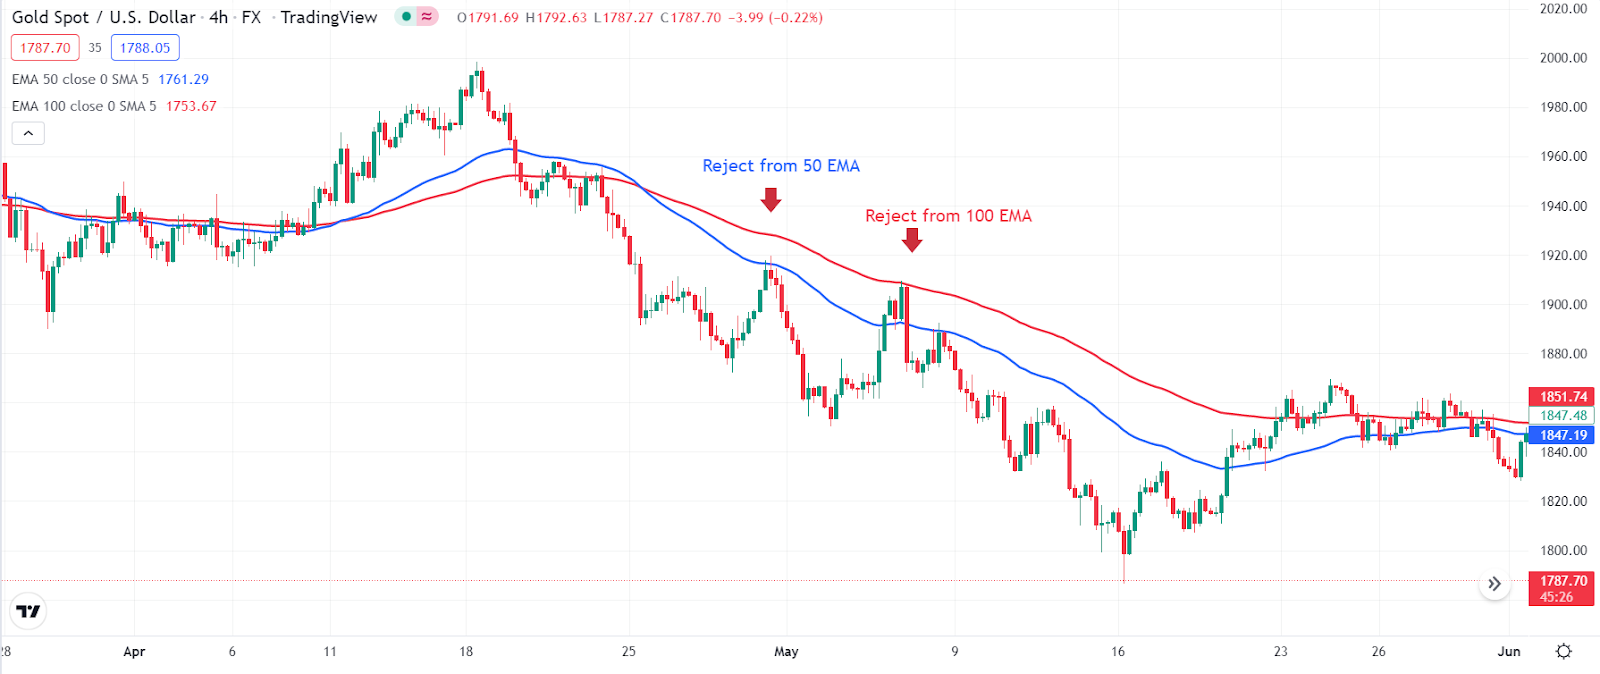
In the XAU/USD 4-H chart below, we have applied two EMAs with different time periods, namely 50 (blue) and 100 (red). You can see that from 20th April onward, the price has assumed a bearish direction, advancing below both EMAs. In this moving average method, opportunities arise whenever the price candles get denied from the 50-EMA or 100-EMA resistance. Also, for every sell-trade position, a stop-loss can be placed a little above the 100-EMA.
3. Moving averages crossover
MA crossover is the most popular moving average method utilized by a large number of traders. As per this strategy, two moving averages, one with a shorter time frame and the other with a larger period, are applied to the price chart. When the shorter MA crosses above the larger-term MA, it creates a buy signal, perpetuating a “golden cross.” On the other hand, when the shorter-period MA crosses below the larger-duration MA, it is known as the “death cross” and signifies a sell signal.
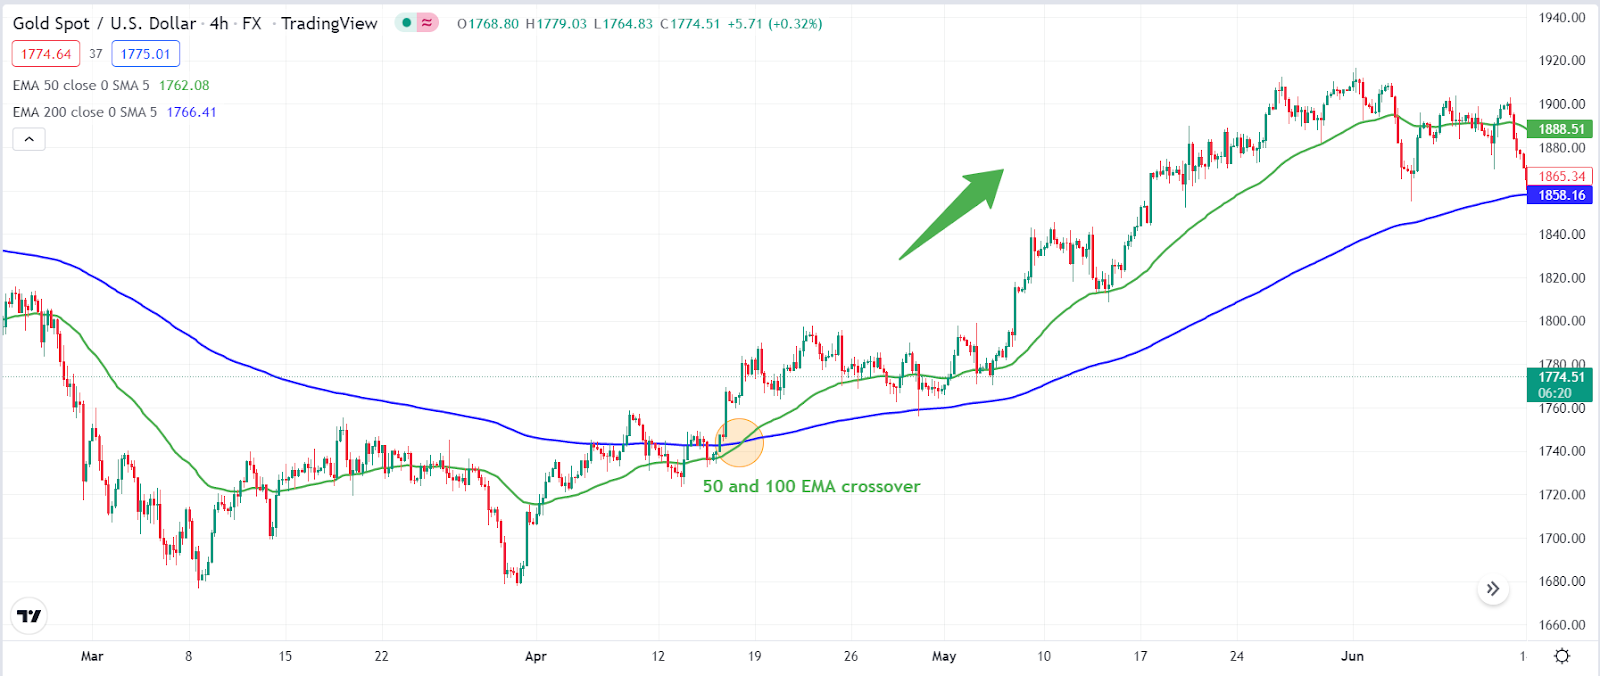
In the XAU/USD chart below, two exponential moving averages are plotted on the graph, one with 50-period (green) and the other with 200-period (blue). A golden cross is formed as the green EMA crosses over the blue EMA. The cross indicates a trend shift towards the bullish category, offering buy-trade opportunities.
4. Trend reversal setup – Retest on moving average
Lastly, in the list, we have mentioned a highly viable and effective moving average method.
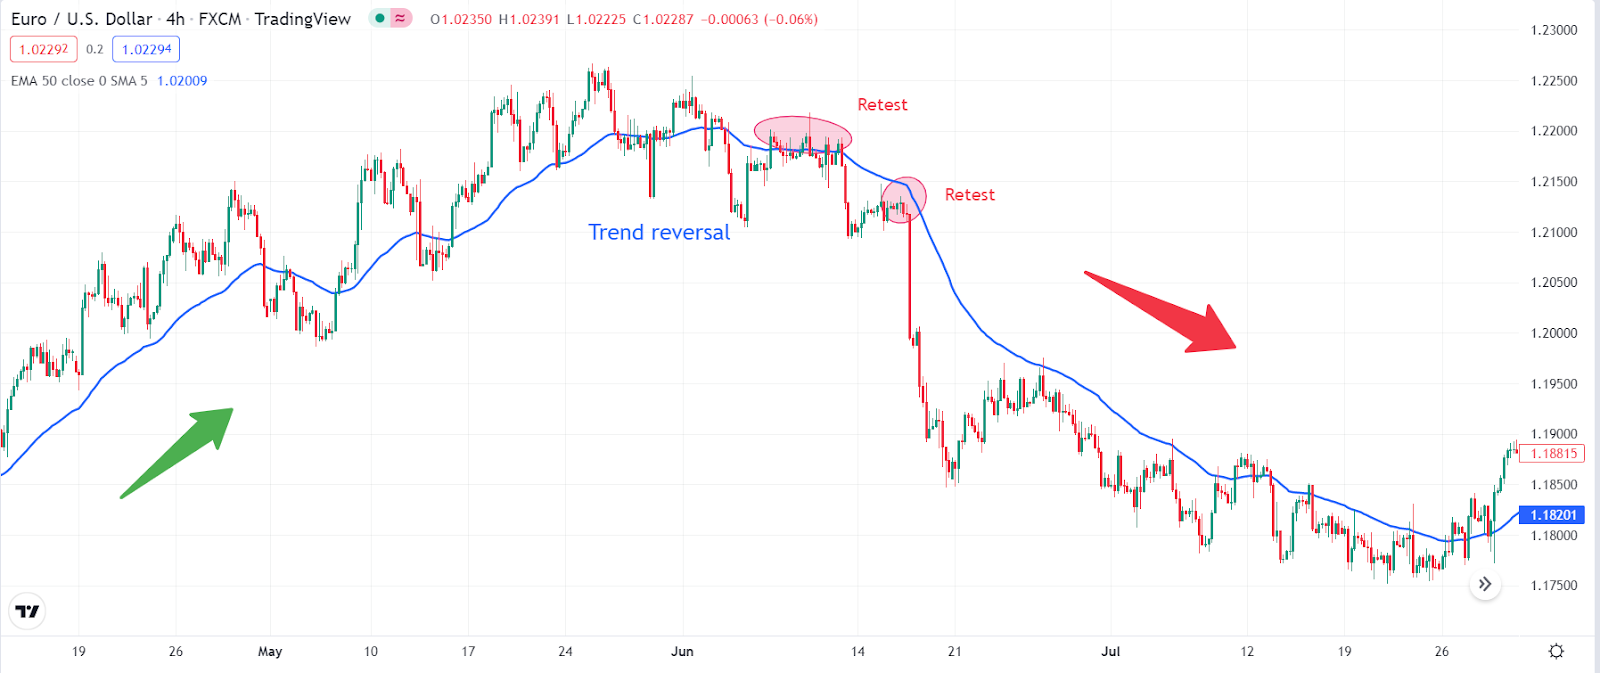
Interestingly, moving averages can complement the price action trading systems and further authenticate the reversals. In the below example, we have displayed a trading configuration where the market is in a reversal mode after forming a head and shoulders pattern. This EUR/USD chart shows a 50-period EMA that provides confirmation for this trend reversal as the price retests it after a crossover. At the retest points, traders can place bearish trade positions to capitalize on the newly forming trend.
Bottom line
Moving averages are one of the most acclaimed and productive trading indicators that can proffer remarkable trade chances. In this write-up, we have explored the strategies based solely on moving averages; however, this overlay tool can also work with other indicators to enact further advanced systems.
All in all, moving average methods can undoubtedly put forward excellent market prospects, but you should never forget that no setup can be profitable 100% of the time. Moving averages can generate several false signals as well, especially on lower time-frame graphs. That’s the main reason we have considered large time-frame graphs for explaining strategies in this article.
In a nutshell, you need to understand that profitability in the financial markets is linked with good risk: reward ratios or risk management, consistency, effective strategy implementation, and realistic expectations.
You may also like:
https://thetradingbay.com/5-best-strategies-in-intraday-trading/
https://thetradingbay.com/best-trading-indicators-of-all-time/


