


It can be said that “trading indicators” are the crown of technical analysis as they disburse valuable information to the technical analysts and price action traders. Indicators are basically mathematical algorithms that utilize the historical price data and trends to exhibit trading opportunities. Simply said, technical indicators present a simplified picture of the market happenings, helping the traders speculate on future price direction.
Although indicators only measure what’s already present (previous price information), they do the “tough” work and compile comprehensive information in a better way; otherwise quite difficult possible to identify.
That said, while you can find an extensive range of indicators on market platforms, only some of them lead the bandwagon due to their time-tested results, higher credibility, and massive adoption. In this article, we have discussed such five best trading indicators you should know about to upgrade your trading results.
But first, let us briefly understand the types of indicators and how they differ from one another.
Trading indicators types
Primarily, indicators exist as either overlays or oscillators. Overlay indicators are those that are plotted over the prices on the main chart, whereas oscillators are generally plotted below the price chart as they fluctuate between two extreme levels.
Further, these are the four types of indicators according to the “what do they analyze?” perspective:
- Trend indicators dominate in recognizing the market direction or trend. Moving average and parabolic SAR are two prominent trend indicators.
- Volume indicators measure the changing volume or the buying/selling activity’s strength. On-balance and Chaikin money flow are two notable volume indicators.
- Momentum indicators determine the bullish and bearish power of the price move, indicating whether the price would reverse or continue its trajectory. The most popular momentum indicators include RSI, MCAD, and Ichimoku cloud.
- Volatility indicators ascertain the price movement’s pace in a specific duration, exhibiting high and low market volatility periods. Average True Range (ATR) and Donchian channel come under the sphere of volatility indicators.
5 Best trading indicators every trader should know about
1. Moving average
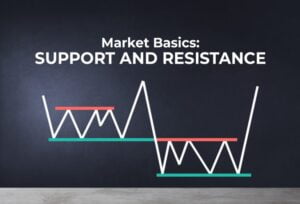
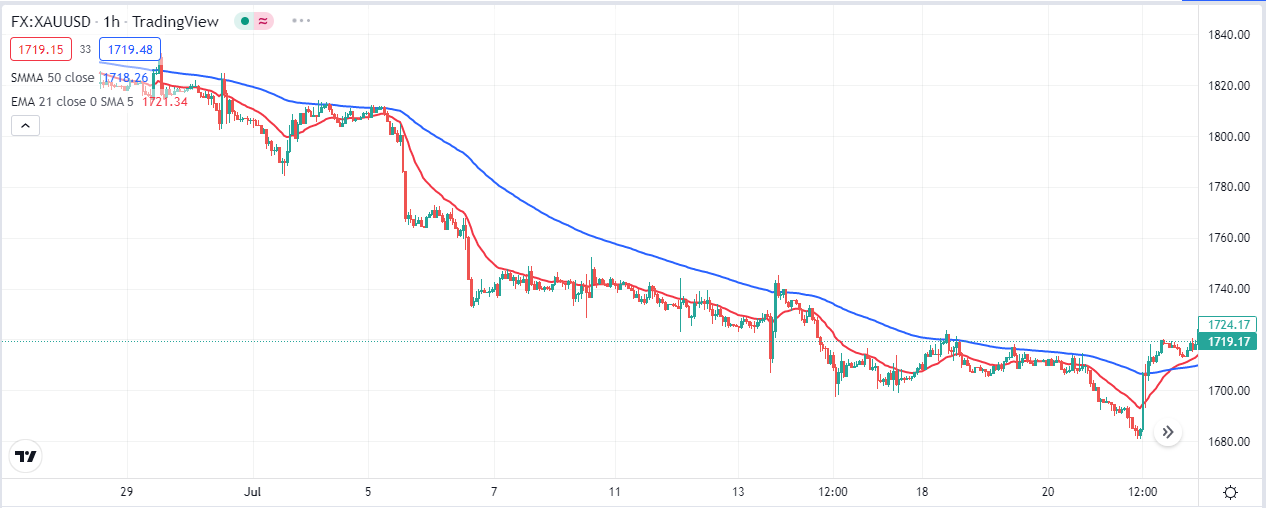
Moving average is one of the most popular trading indicators that averages out the price data of a specific past period, manifesting a dynamic and constantly updating “average line.” It is a lagging indicator that identifies the trend direction and support/resistance levels of assets according to previous prices. Further, moving average is a customizable tool where you can manually set its time period, like 50, 100, 0r 200, according to your preference.
Also, note that moving averages exist in two forms, namely simple moving average (SMA) and exponential moving average (EMA), where EMA provides more weightage to recent prices as opposed to SMA. Generally, traders consider the “moving averages crossovers” to spot trend reversals and “bounce from the average” to recognize in-trend trading opportunities.
2. Relative strength index (RSI)
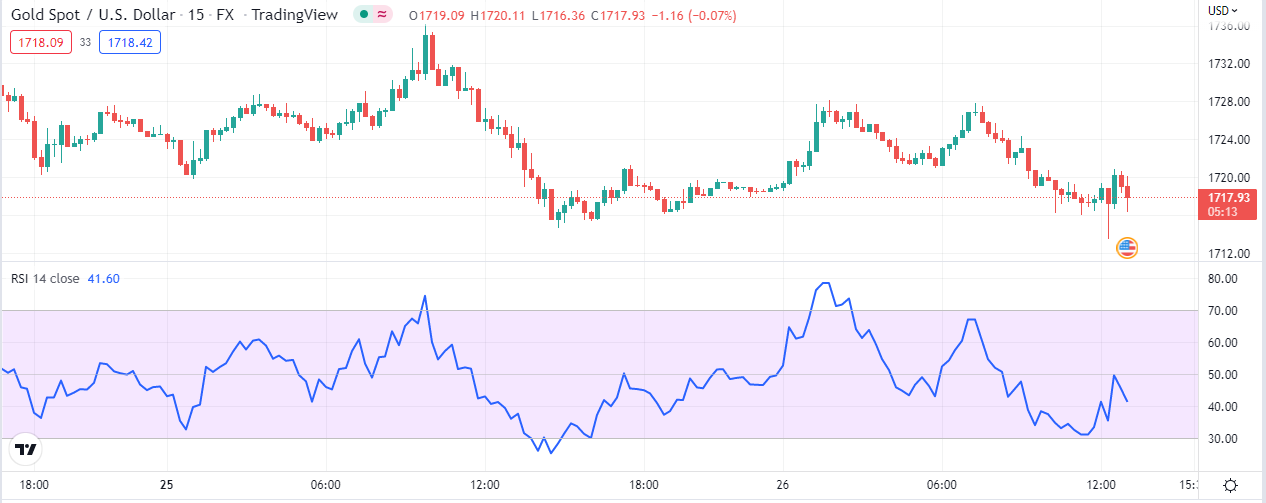
The relative strength index is considered to be one of the best trading indicators that measure the momentum of price on a scale of 0 to 100. RSI evaluates the speed and magnitude of an asset’s price changes to identify its “overvalued” and “undervalued” situations. Traditionally, traders deem the 70-above RSI as a bearish signal, whereas 30-below RSI as a bullish indicator.
However, RSI is tricky to use as you may enter wrong trades during oversold or overbought conditions. For instance, if you enter a “buy” position during an oversold instance while the strength index corrected itself at the 50-level later on, the price could again resume its bearish direction, stopping you out. Hence, you should carefully develop an RSI trading strategy considering your risk appetite or utilize it in conjunction with other indicators to minimize the noise.
3. Fibonacci retracement levels
The Fibonacci indicator draws out horizontal lines between two extreme price points where the price could likely retrace.
The Fibonacci levels are indicated by percentages that determine the retracement magnitude of price. The most commonly utilized levels are 23.6%, 38.2%, 50%, 61.8%, and 78.6%. From the trading perspective, these key ratios signify the zones where the price could potentially pull back and resume the initial trend; otherwise, it would continue to reverse.
Below is an illustration of the usage of Fibonacci retracement. You can see that Fibonacci is drawn between a swing high and swing low that are circled out. Price pulled back to the 50% level and resumed its upward trend, providing the traders an ideal position to catch the move.

4. Parabolic SAR
Parabolic stop and reverse is a simple trend indicator that forms as a series of dots on the price chart. When the dots appear above the price, it stipulates that the market is in a downtrend. In contrast, if they display below the price, it signifies an uptrend.
Traders mostly utilize the parabolic SAR crossovers to enter a position. For example, a buy trading opportunity materializes when the dots proceed from below the price to above it. On the other hand, a bearish signal develops when the dots move from below the price candles to above them.

5. Ichimoku Cloud
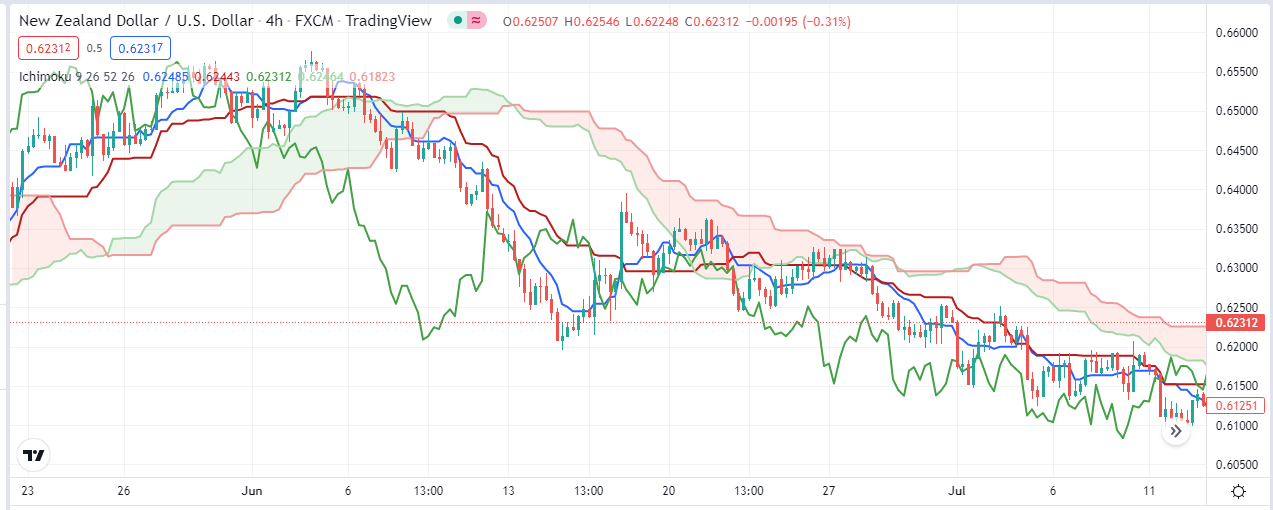
Ichimoku is an all-inclusive technical indicator that is composed of multiple lines and a band. This seemingly complex indicator helps in specifying the trend direction, price momentum, and future support & resistance levels.
The Ichimoku cloud is comprised of five lines, namely Kijun Sen, Tenkan Sen, Chikou Span, and Senkou Span (a band formed by two lines). Some of these lines are individual moving averages of nine, 26, and 52 periods while one is an average of the Tenkan Sen and Kijun Sen.
The Senkou Span, a green/red cloud, is the chief component of this indicator as the lines of this band pose as dynamic support or resistance for the price. Further, when the price moves below the cloud, the market trend is termed “down.” In contrast, when the price advances above the cloud, it stipulates a bullish market trend.
Closing thoughts
While we have compiled a short list of the best trading indicators, you can also find a whole lot of other popular tools and indicators on trading platforms. However, you should remember that as most indicators are lagging, they work best only as an auxiliary input to enhance your overall trading strategy.
Moreover, almost all indicators generate several false or poor signals as well; hence this is another reason not entirely to depend on indicators. For once, you can establish your personalized trading system and backtest your strategy under various conditions to increase the win ratio. Altogether, it is your duty as a trader to consider multiple indicators and determine which one compliments your trading approach the most to achieve positive results.
You may also like:


