Throughout history, Gold (XAUUSD) has garnered profound admiration for its enigmatic magnetism – both as a tangible entity and an economic haven. It has endured the trial of time for eons and emerged as one of the most coveted safe-haven assets. Despite the rise of fiat currency systems, Gold’s inherent and economic value remains unscathed, positioning it as a favored investment in today’s financial markets.
In the past, trading Gold was a cumbersome process, demanding the physical possession of the precious metal. However, the advent of Contract for Difference (CFD) trading has revolutionized the landscape, empowering traders to engage with Gold without the necessity of physical possession. This revolutionary stride has unlocked opportunities for traders to partake in Gold trading just like forex trading, granted they have access to a CFD brokerage platform.
As the enticement of Gold endures in today’s world, CFDs have materialized as a nexus between tradition and innovation, rendering XAUUSD trading more accessible and dynamic than ever before.
What drives Gold (XAUUSD) prices?
Gold, revered for its luster and nobility, has been central to global commerce for centuries. Its value is driven by a complex interplay of supply, demand, and various macroeconomic factors. Here’s a closer look at what drives gold prices.

Foremost among these forces is the delicate equilibrium between the forces of supply and demand. Being a precious metal of great significance, Gold is held dear as a sanctuary during periods of economic uncertainty. Its scarcity, enduring resilience, and imperviousness to artificial replication render it an exceptional hedge against inflation. In times of economic downturns, investors seek solace in this yellow metal, igniting a surge in demand that, in turn, propels its price skyward. Meanwhile, on the supply side, the activities of mining companies that unearth this precious metal and the transactions involving gold reserves by central banks can significantly sway the trajectory of gold prices.
Secondly, inflation and deflation also exert a profound influence on the Gold (XAUUSD) value. For many, Gold stands as a bulwark against the erosive effects of inflation, shielding investors from the erosion of their currency’s value. As inflation escalates, the allure of Gold as an investment intensifies, for it steadfastly preserves its value, unlike the transitory nature of paper money. Conversely, during deflationary periods when the value of money rises, the demand for Gold as a safeguard against inflationary tides may recede, leading to a decrease in gold prices.
Besides the factors mentioned above, the capricious emotions of humanity, namely greed, and fear, also cast a formidable effect on gold prices. In times of fear, when the air is thick with geopolitical tensions, economic distress, or market volatility, investors often turn their gaze toward the Golden Refuge, catapulting its price to soaring heights. However, during seasons of economic prosperity and stability, the allure of other ventures brimming with heightened reward probability may tempt investors away from Gold, possibly leading to a wane in its price.
Moreover, the interplay between Gold and the US Dollar is another crucial factor affecting the Gold price dynamics whereby the yellow bullion is typically traded against the USD. Note that the two entities often dance in tandem with an inverse correlation. When the Dollar flexes its muscles and grows stronger, it makes dollar-denominated commodities, like Gold, more expensive for holders of other currencies. This could potentially lower the demand for Gold, leading to a decrease in its price. Conversely, Gold (XAUUSD) prices rise when the USD wanes and its strength diminishes.
However, it is important to remember that this is a general principle and does not hold in every specific case. The relationships between currency values, commodity prices, and investor behavior can be influenced by a multitude of factors and can sometimes behave in ways that simple economic models cannot predict.
Gold (XAUUSD) RSI strategy
For traders seeking to capitalize on gold price fluctuations without the need to possess the asset physically, the Gold RSI strategy stands out as an exceptionally effective approach to achieving substantial gains.
The Relative Strength Index, commonly referred to as the RSI indicator, is a powerful momentum indicator that gauges the strength of price fluctuations and movements. RSI divergence, a key concept in RSI analysis, occurs when the RSI indicator moves in the opposite direction to the price. In simple words, as the price undergoes changes, the RSI provides us with valuable early signals, hinting at potential shifts in direction.
Within the realm of Gold trading, we identify two distinct types of RSI divergence, and these serve as the foundational basis for this carefully crafted strategy.
Positive (bullish) RSI divergence Gold strategy
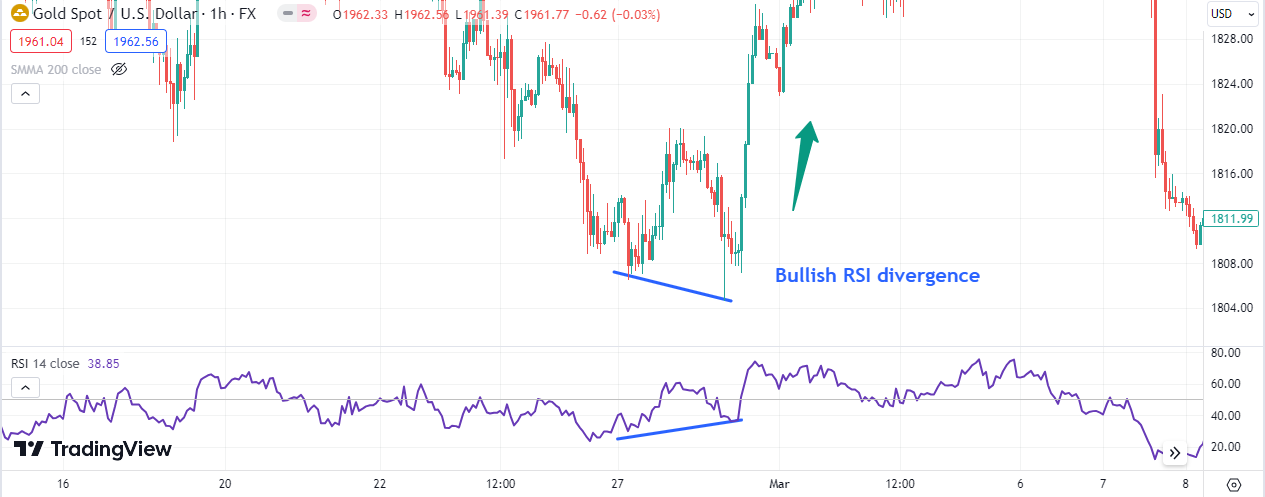
A regular bullish divergence occurs when the price of an asset is forming lower lows (LL), but the oscillator, such as the Relative Strength Index (RSI), is forming higher lows (HL).
This bullish divergence pattern often emerges towards the conclusion of a downtrend, indicating a potential trend reversal. Once a second bottom is established, if the oscillator fails to register a new low, it suggests that the price is poised to ascend. This alignment between price and momentum signals an increased likelihood of an upward movement, as historically, price and momentum tend to exhibit a harmonious relationship.
The XAUUSD 1-H chart shows an example of bullish divergence, with the price forming a lower low while the RSI makes a higher low. Traders can wait for confirmation of a bullish candlestick before entering a long position. Using caution and additional technical indicators can improve the likelihood of successful trades.
Negative (bearish) RSI divergence Gold (XAUUSD) Strategy
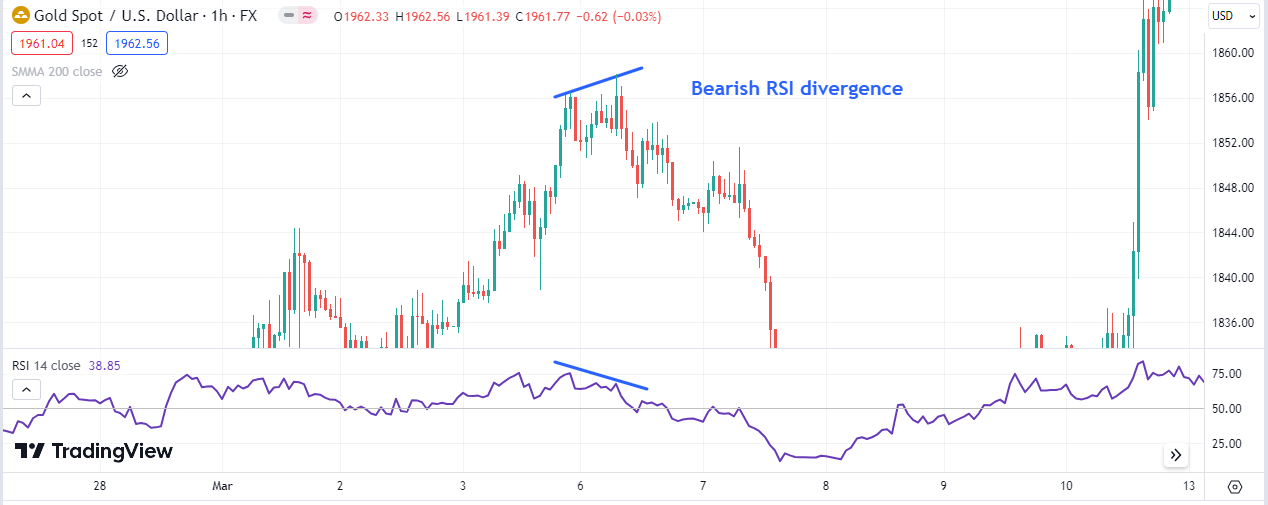
Regular bearish divergence manifests when the price of an asset forms a higher high (HH), while Relative Strength Index (RSI) creates a lower high (LH). This distinctive pattern typically arises within an uptrend, signaling a potential reversal in the market. As the price reaches a second high point, if the oscillator fails to reach a new high and instead shows a lower high, it suggests that a downturn in price is likely on the horizon.
In the 1-hour chart for XAUUSD illustrated below, one can observe that while the price established a higher high, the RSI conversely marked a lower high. This phenomenon is recognized as a bullish divergence. Upon identifying this divergence, traders may patiently wait for a confirming bullish candle before entering into a short position.
Read more:
https://thetradingbay.com/swing-trading-3-top-swing-trading-strategies/