


Key Insights:
- Ethereum’s price plummeted below $3,100 amidst market turbulence, shedding 18% in just one week, raising concerns among investors.
- Factors such as the ongoing Federal Reserve meeting, SEC’s postponement of ETF decisions, and Grayscale’s proposal have contributed to Ethereum’s price volatility.
- Ethereum faces significant resistance around $3,200, with the $3,400 level posing a major obstacle to any potential upward movement.
Amidst a broader downtrend in the cryptocurrency market, Ethereum’s price has taken a significant hit, dipping below the $3,100 mark. This decline, amounting to an 18% drop over the past week, signals a concerning trend for investors.
Just days ago, Ethereum soared to heights above $4,000, instilling optimism among traders. However, the current downturn has dashed those hopes, with ETH struggling to maintain its position above $3,000.

ETH/USD price chart: CoinMarket Cap
The recent bearish sentiment is exacerbated by the failure of the ETH Dencun Upgrade to drive price s to all-time highs. Despite expectations of a bullish rally, the upgrade has failed to deliver the desired results, leaving ETH trading at a considerable distance, almost 30% away from its ATH.
Although the current situation appears bleak, Ethereum’s trading volume tells a slightly different story. With a 37% surge in trading volume from the previous day, Ethereum’s market activity remains robust, surpassing $34 billion.
Why is Ethereum’s Price Declining
The price of Ethereum has experienced fluctuations, influenced by various factors, including recent developments in the regulatory landscape and investor sentiment.
One significant contributor to the current volatility is the Federal Reserve meeting, which has historically triggered turbulence in the crypto market. As discussions unfold regarding interest rates and economic policies, investors brace themselves for potential impacts on the cryptocurrency industry. The outcome of these meetings often dictates market sentiment, with concerns over potential shifts in regulatory stance towards cryptocurrencies weighing heavily on investors’ minds.
Adding to the uncertainty is the recent decision by the US Securities and Exchange Commission (SEC) to postpone its ruling on the Hashdex Nasdaq ETH exchange-traded fund (ETF) until May 30, 2024.
This delay, coupled with similar postponements for other Ethereum ETF proposals, has cast doubt on the imminent approval of such investment vehicles. The SEC’s continued evaluation and public solicitation of input further contribute to the ambiguity surrounding the regulatory framework for cryptocurrencies.
In parallel, Grayscale’s proposal to incorporate staking into its spot Ether ETF application has garnered attention. While the move aims to enhance the attractiveness of the Grayscale Ethereum Trust, its success hinges on obtaining majority approval from stakeholders.
Analyzing Ethereum’s Support and Resistance Levels
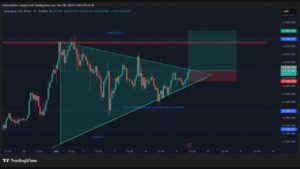
Ethereum’s recent price movement has been marked by a downward trend, notably slipping below the crucial $3,300 support level and the 100-hour Simple Moving Average. The correction began below the $3,300 mark, signaling a challenging phase for ETH in the short term.
Despite attempts to break above the $3,600 and $3,500 levels, ETH continues to face resistance, leading to a further drop below $3,300. The downward momentum persisted, with the price slipping below the $3,100 support level, reaching lows around $3,050, and currently consolidating these losses.
In terms of resistance and support levels, Ethereum faces immediate resistance around $3,200, with surpassing the significant hurdle of $3,300 proving difficult. The critical resistance at $3,400 poses a formidable challenge, with a descending trend line limiting upward movements.
Looking ahead, Ethereum’s upward potential hinges on surpassing the $3,600 resistance, propelling it toward $3,700 and beyond, reaching $3,800, or even testing the $4,000 mark. Conversely, failure to break above the $3,400 resistance could sustain the downward trend, with $3,000 serving as the initial support level, followed by $2,700 if further losses occur.
Ethereum Technical Outlook
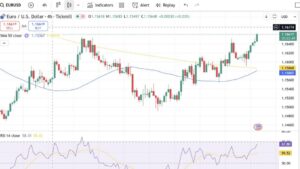
Ethereum displays a bearish sentiment as major technical indicators lie in the negative territory. The Moving Average Convergence Divergence (MACD) indicator has shifted from the positive region as it drops below the zero line to form red bars on the histogram. The MACD line has dropped below the signal line, which suggests a shift in the bullish trend as the bears hold the ground tight.
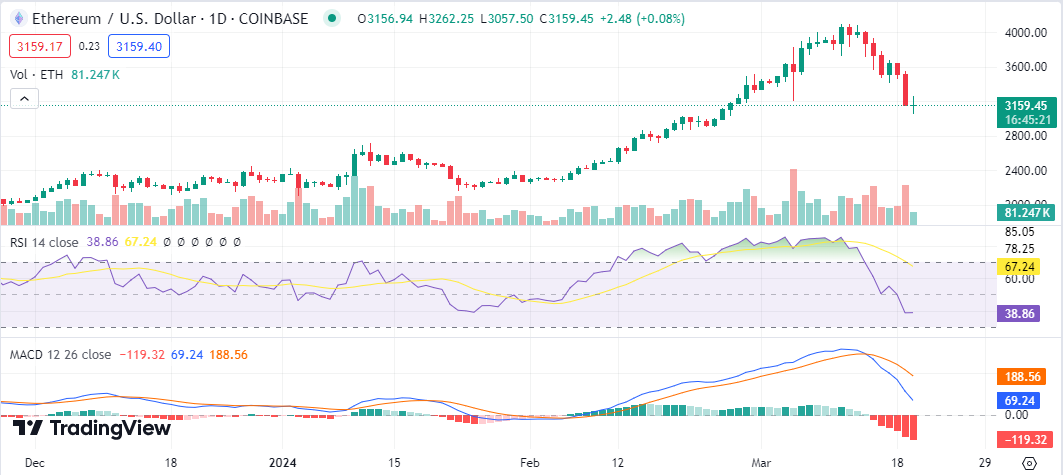
ETH/USD chart: TradingView
The Relative Strength Index (RSI) indicator has dropped below the neutral level at the 50 index, currently at 38, heading toward the oversold region, indicating an increase in selling pressure.


