Having knowledge about trading volume holds immense importance for traders due to various reasons. Firstly, it imparts a valuable understanding of market liquidity, facilitating effective transactions. Furthermore, deviations in volume data, whether higher or lower than usual, often signify sustained activity or an approaching conclusion to a trend. Trading volume also serves as an indicator of potential market manipulation or the participation of influential entities.
By carefully observing such patterns, astute market participants can determine opportune moments to execute trades. In this article, we will explore a trading indicator known as the volume-weighted average price, which considers the trading volume and provides dependable trading prospects for traders.
What is VWAP in trading?
The volume-weighted average price, commonly referred to as VWAP, serves as a means to assess the typical price of a financial instrument while accounting for its trading volume. This tool, employed in the analysis of intraday charts, resets at the commencement of each fresh trading session.
In essence, the volume-weighted average price encapsulates the combined mean price relative to volume, representing the typical price at which a security is transacted throughout the day, accounting for both volume and price. This aids traders in comprehending the liquidity of the market, evaluating the effectiveness of their trade executions, and recognizing potential trading opportunities.
It is visually depicted on the chart as a dynamic average.
The VWAP calculation is expressed by the following formula:
VWAP = (Σ (Price × Volume)) / Σ Volume
In this equation:
- Price denotes the value of the security at a precise moment in time.
- Volume signifies the number of shares or contracts transacted at that specific value.
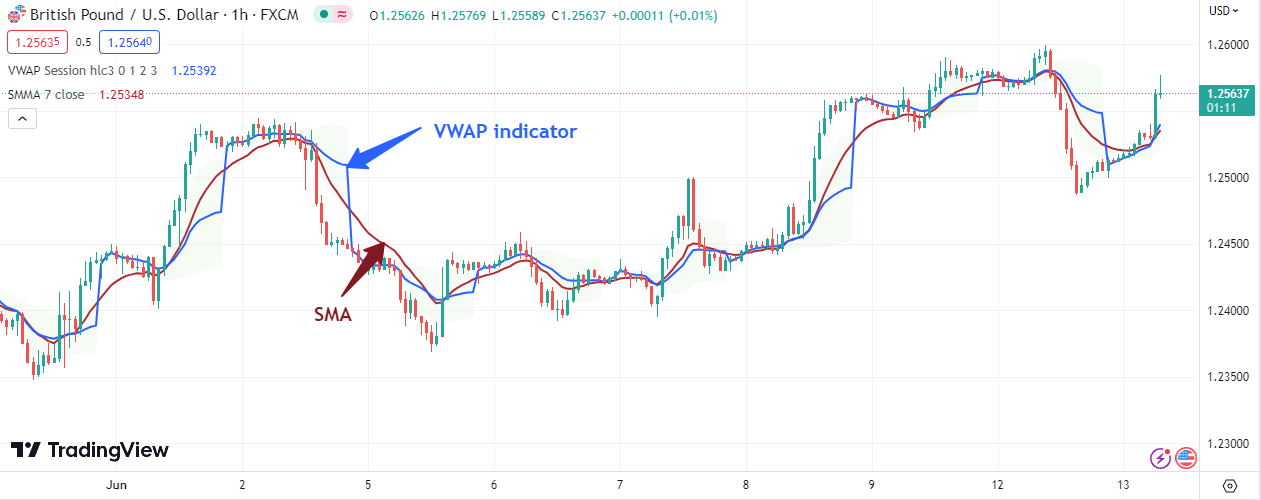
Comparing the Moving Average vs. VWAP
When observing a chart, the VWAP and a simple moving average (SMA) may bear a resemblance, yet their calculations and resulting interpretations diverge.
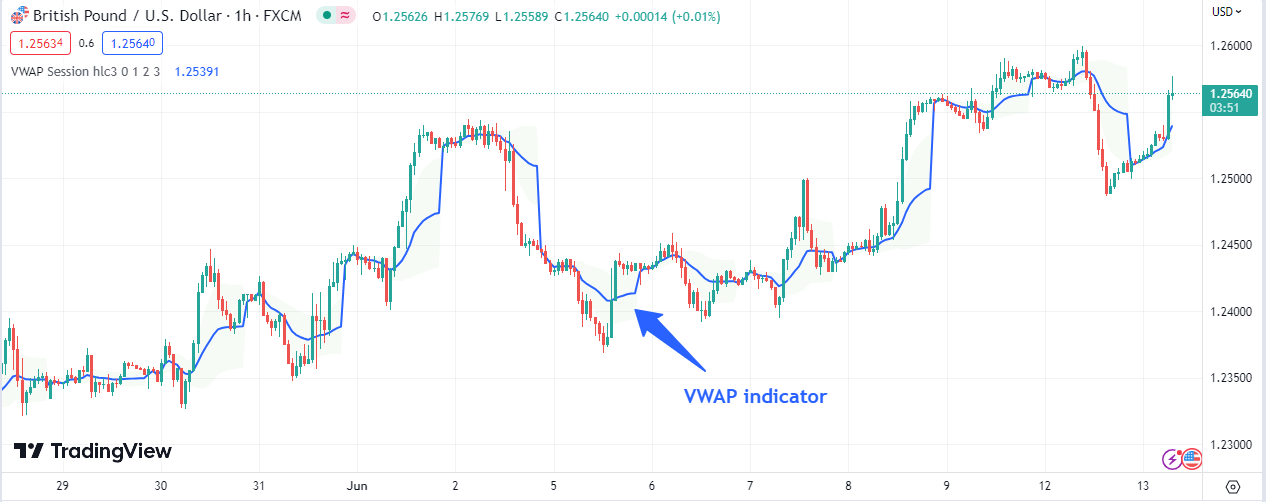
Let us consider the GBP/USD currency pair’s price movements over a scale of five hours. On an hourly chart, we activated the SMA indicator and set it to calculate the average of the most recent five hourly closing prices. As the closing prices were 1.27100, 1.27200, 1.27300, 1.27400, and 1.27500, the indicator exhibited an average price of 1.27300 (summing the five values and dividing by five).
Now, let us contrast this with the application of VWAP to the same asset and settings. VWAP takes into account volume data, indicating the lots of GBP/USD transacted at each of the five prices, assigning greater significance to prices associated with higher trading volumes.
For instance, suppose the majority of the volume during these five hours occurred at 1.27200. In such a scenario, the VWAP would reflect an average price in close proximity to 1.27200, significantly lower than the price derived from the simple moving average. The latter solely considers price and time, granting equal weight to every price in the averaging calculation.
Consequently, some traders place greater trust in VWAP as it functions as a more precise indicator of price action. In technical analysis, volume remains a pivotal factor for confirming trends, identifying trend reversals, discerning support and resistance levels, predicting breakouts, and assessing breakdowns.
How to apply the VWAP trading strategy?
VWAP is a commonly employed tool by traders for assessing their performance in executing trades.
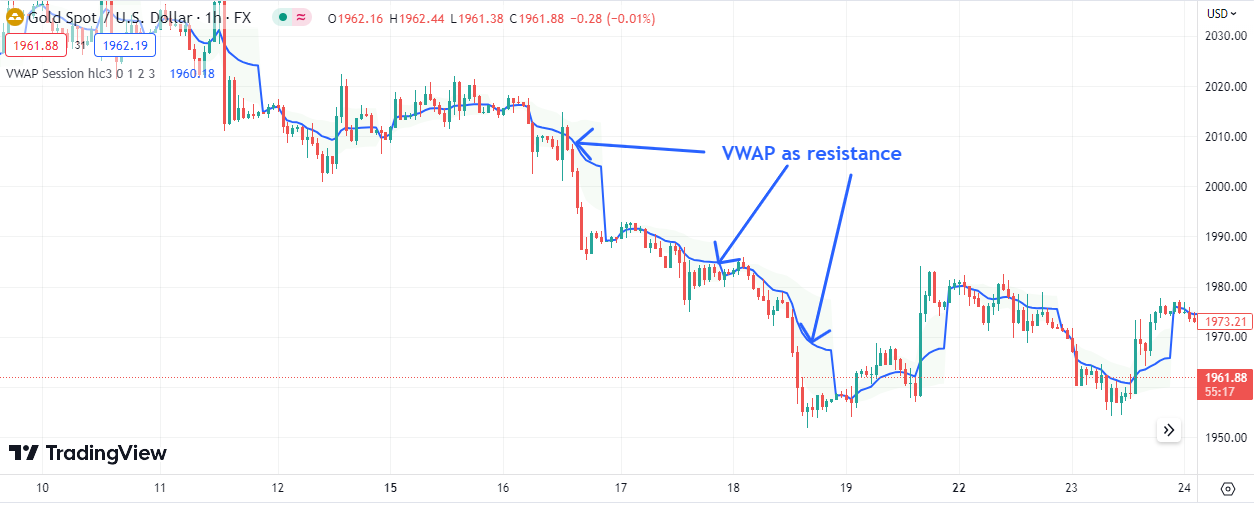
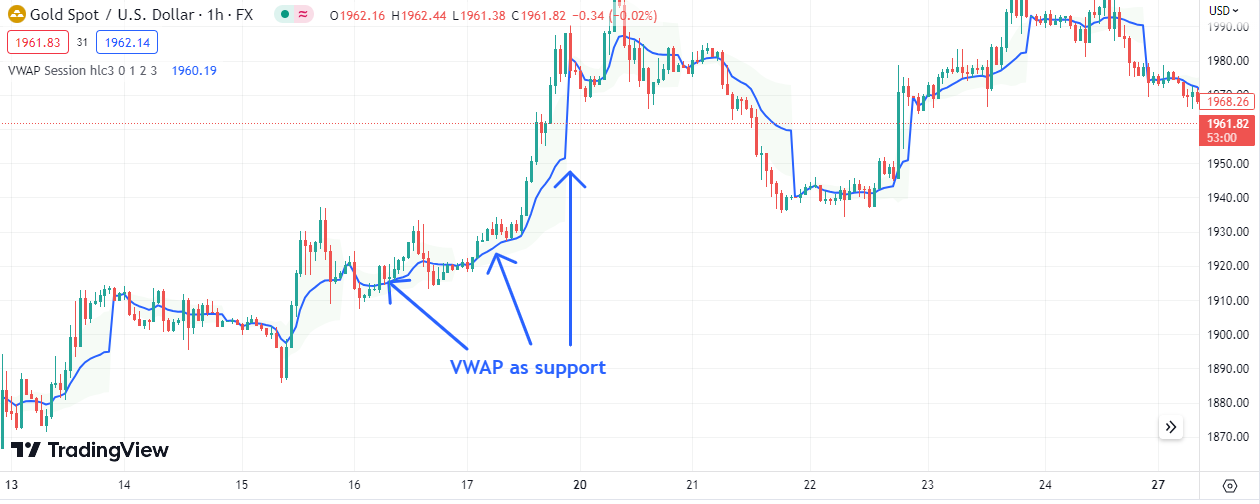
VWAP as support and resistance
If the price surpasses the volume-weighted average price (VWAP), it could serve as a support level, indicating a beneficial trading zone. Typically, during an upward trend characterized by higher highs and higher lows, the VWAP smooth line functions as a support. Once the price experiences a minor pullback towards the VWAP support line, it then rebounds after being rejected by it.
Similarly, if the price falls below the VWAP, it might function as a resistance level, suggesting that the security is being traded at a less favorable price. In this scenario, the price rebounds from the VWAP line following a minor pullback.
To make trading decisions, consider looking for selling opportunities when the price is below the volume-weighted average price indicator and buying opportunities when the price is above the VWAP.
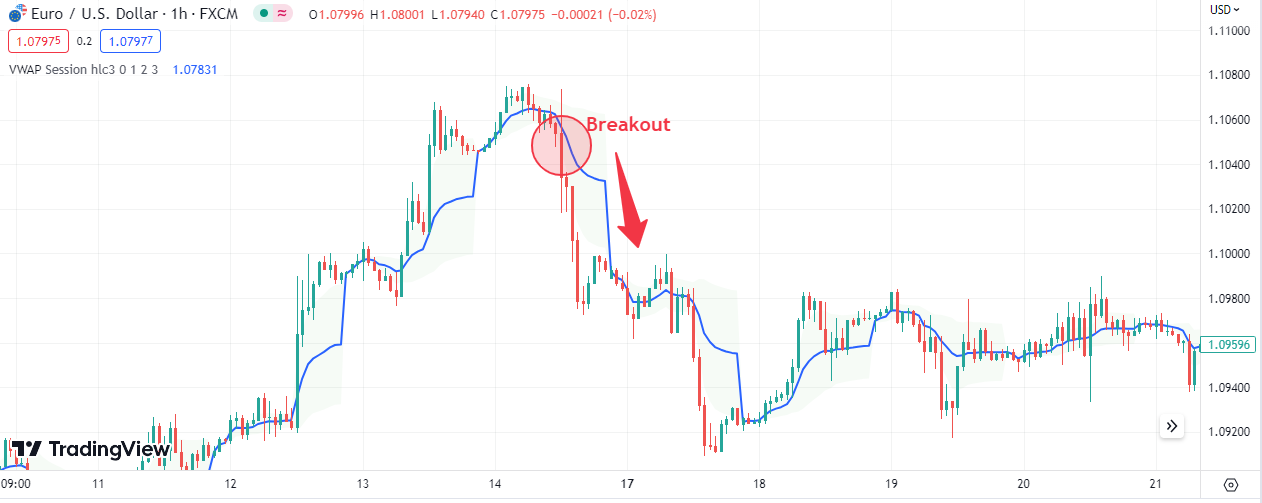
Trading breakouts and reversals with VWAP
VWAP can also be a valuable tool for traders seeking to detect potential breakouts and reversals.
When the price crosses over the VWAP, it can indicate an establishing bullish trend, providing a signal for traders to consider opening long positions. Conversely, when the price crosses below the VWAP, it may suggest a bearish trend, prompting traders to consider short positions.
To avoid false breakouts, it is advisable to look for substantial candlestick breakouts and then wait for the formation of two to three additional candlesticks after the breakout.
Confluence trading with VWAP
In addition, traders can enhance their analysis by combining VWAP with other technical indicators such as moving averages, RSI, or Bollinger Bands. This combination helps validate trading signals and has the potential to enhance the overall accuracy of the trading strategy.
Moreover, by comparing the average price of traders who execute trades with the VWAP, they can gauge whether they have achieved favorable prices or if they have incurred excessive costs (or obtained insufficient value) for the security. Traders may additionally utilize VWAP as a means of confirming trends and constructing trading rules based on it.
Limitations of VWAP trading strategy
VWAP is a daily indicator that resets at the start of each new trading day. Attempting to calculate an average VWAP over multiple days may lead to distortion and produce an inaccurate signal.
While certain institutions may favor buying securities when their prices are below VWAP or selling when they are above it, VWAP should not be the sole determinant. During robust upward trends, prices can persistently rise without dipping below VWAP or only occasionally touching it. For instance, significant price spikes or drops can influence VWAP and reduce its reliability.
Thus, traders should exercise caution when utilizing VWAP in volatile markets or during news events. Market contestants should not solely depend on VWAP for making trading decisions; instead, they should combine it with other technical tools, such as trend lines, moving averages, or oscillators, to achieve optimal results.
What is anchored VWAP?
Conventional VWAP calculations always commence with the first bar of the day and conclude with the final bar of the day. However, in certain scenarios, a technical analyst may want to assess the VWAP line based on a different starting point and extend it beyond the end of the trading day. Enter the concept of anchored VWAP!
Anchored VWAP is derived from a specific historical “anchor” event, in contrast to the standard VWAP, which starts from the beginning of a day. This approach enables the designation of a particular price bar as the starting point for calculations, providing a clear view of whether bullish or bearish sentiments have predominantly controlled the market since that precise moment.
Note that the chosen starting price bar (anchor point) typically corresponds to a pivotal shift in the market, such as a notable high or low, significant earnings release report, impactful news, or other prominent announcements.
Read more:
http://thetradingbay.com/2023/04/28/what-is-forex-algorithmic-trading/