Wyckoff accumulation signifies one aspect of the revolutionary Wyckoff schematics theory, first unveiled by the pioneering mind of Richard Damielle Wyckoff in the early 20th century. Richard and his colleagues uncovered some innovative approaches and theories to analyze the financial markets, specifying how to identify some lucrative trading zones.
This article will delve into the details of Wyckoff accumulation as well as its prominent events and phases. Also, find out if this strategy can be used to navigate the ever-changing world of cryptocurrency trading.
What is Wyckoff accumulation?
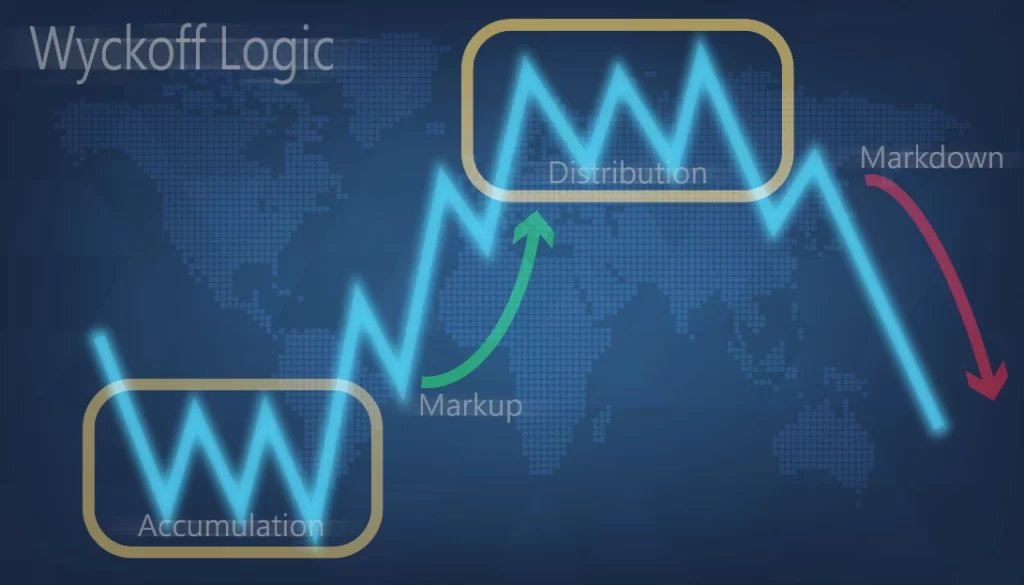
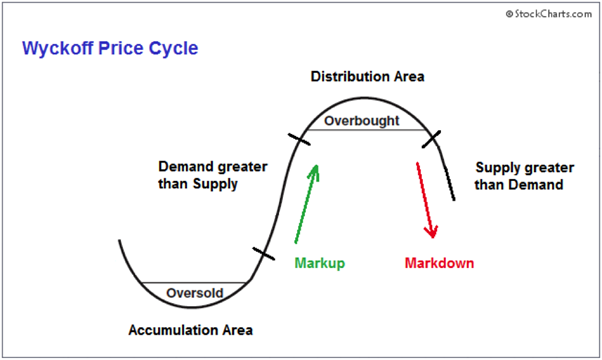
Wyckoff accumulation refers to the market phase where big institutions gear up to boost demand, eventually building substantial buying pressure. It marks one stage of the Wyckoff cycle – the other three being the markup, distribution, and markdown. Note that “trading ranges (TRs)” are a crucial concept in this method which define the accumulation and distribution zones. These areas, where prices oscillate between predetermined high and low points, signify a delicate equilibrium between supply and demand.
Wyckoff theory is based on three primary “laws” that help in identifying market bias & forming analysis perspectives. Wyckoff theorized that by carefully examining the supply and demand dynamics (evident from the price action, volume, and time), not only the market may be comprehended but the future price direction may also be speculated. The three laws that cover the Wyckoff approach include:
- The law of supply and demand
- The law of cause and effect
- The law of effort vs result
The accumulation phase holds specific importance for investors or traders as it suggests that an upward price rally is on the horizon. With an enhanced demand and accumulation of assets within a trading range (TR), the supply sharply drops, causing the price to soar higher. As the price begins forming higher lows, it ultimately shifts to the “markup” phase of Wyckoff schematics whereby a strong upward trend takes hold.
A look into the Wyckoff accumulation schematics: Phase A to E
Let us understand the key events of Wyckoff accumulation and how they lead to a strong bullish trend
Phase A
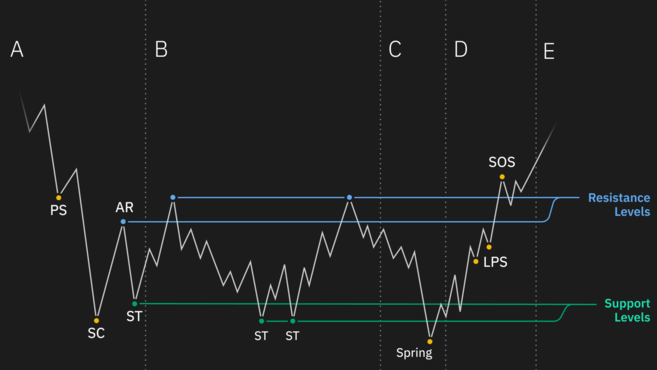
Phase A, the first phase of Wyckoff accumulation, denotes the possible conclusion of the previous downtrend. Up until this point, supply has been in control of the market but now the gears start shifting. This “pause” phase assimilates four major events:
- PS (Preliminary Support) – It is the point where notable buying begins to form a potential support zone. The volume surges along with the price pump, suggesting that the bearish wave is near its end.
- SC (Selling Climax) – It signifies the near bottom or bottom area of the Wyckoff cycle where the selling pressure generally peaks. At SC, large institutional or professional investors typically absorb the panicked selling from retail investors.
- AR (Automatic Rally) – After the selling climax, prices easily depart in an upward direction amid elevated purchasing and short positions-covering. AR specifies the top boundary of the accumulation trading range (TR).
- ST (Secondary Test) – As part of the secondary test, the price retraces to the SC level for assessing the supply/demand balance. As the market completes its ST, volume and price spread should shrink significantly to confirm the accumulation bottom. Note that this test may be repeated multiple times after an SC.
Phase B
Based on the law of cause and effect, in phase B of Wyckoff accumulation, price crafts a reason for an upcoming uptrend. At this stage, the market presents a scenario like a “tug of war”, as there are several Secondary Tests and movements towards the upper end of the trading range. As the TR takes shape, major players strive to scoop up as much of the remaining supply as they can, setting the stage for the next phases.
Phase C
Phase C conducts the final test for floating supply, determining whether the asset is ready to be “marked up.” This event typically includes a low volume “spring” where the price dips below the TR’s low before bouncing back, allowing powerful investors to trick unsuspecting players as well as buy assets at the best bargain.
In other words, a bear trap is created whereby it seems like the downward trend is set to continue, but in reality, it’s the beginning of a bullish reversal. Wyckoff’s technique of “spring” (or a shakeout) highlights a prime opportunity for traders to jump in and capitalize on the potential upward move.
Phase D
This phase fortifies the sheer dominance of demand over supply, manifested through significant price action in the form of SOS and LPS points.
- SOS (Sign Of Strength) – It is described as a dramatic spike in price, characterized by a relatively wider price spread and low volumes. The SOS reinforces the concept of a ‘spring’, stamping its vitality with a powerful price surge.
- LPS (Last Point of Support) – LPS simply demonstrates a pullback from the SOS peak. It typically involves lesser volume and spread as the price retracts back from the SOS (resistance) to LPS (support).
Phase E
In the final stage of Wyckoff accumulation, the price exits the upper boundary of accumulation TR and the markup stage becomes quite clear. Demand takes the reins and any price setbacks, such as shakeouts and typical reactions, are temporary hiccups on the road to markup.
Can you trade crypto using Wyckoff accumulation analysis?
Wyckoff analysis can certainly be applied to the crypto markets, but the wild and unconventional nature of digital currencies means that the risks involved may be greater than with traditional markets. In other words, while a Wyckoff accumulation in the crypto market could potentially lead to massive price rallies, there’s no guarantee that it will.
As per Cointelegraph, in March 2020, Bitcoin’s SOS phase became apparent when its price reached nearly $9,000. However, it then dropped below $5,000 by the middle of the month, disregarding positive signals from the Wyckoff method due to the market crash caused by COVID-19 turmoil.
That said, short-term crypto traders can find immense trading opportunities with the trading range of Wyckoff accumulation. For instance, traders could pounce on a rebound from the ST range, opening a long position and aiming for the AR level as their ultimate profit destination.
On the other hand, the traders eager to capitalize on a long-term price move can supplement their Wyckoff accumulation analysis with fundamental factors to enhance their success chances. For example, Bitcoin’s Wyckoff accumulation setup between May 2021 and November 2021 led to a dizzying price rally from around $37,000 to f $69,000 (after the price departed from Phase E). This upward momentum was triggered by a combination of fundamental forces, like a lenient monetary policy and the increasing adoption of cryptocurrency.
Current scenario: January 23, 2023
According to a coinphony analysis, Bitcoin has officially entered phase D of Wyckoff accumulation after successfully testing the spring.
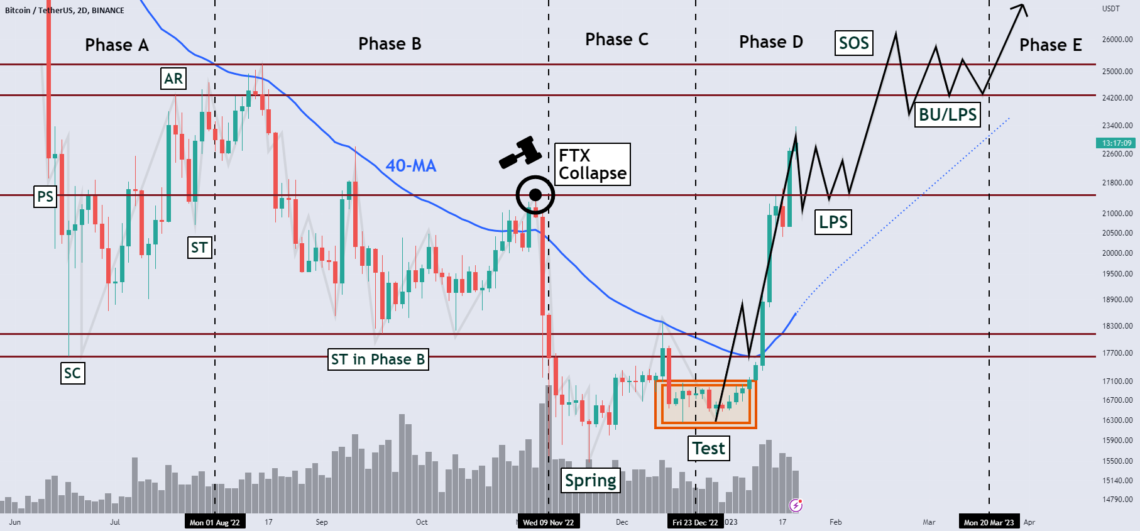
Now Bitcoin is ready to complete further dynamics of Wyckoff accumulation by using the $21,400 level as a potential LPS. If Bitcoin were to rise above the $25,500 marker (SOS), it could serve as a sign that the Wyckoff momentum cycle has reached its final stage, potentially leading to a triumphant markup.
Read more:
http://thetradingbay.com/what-is-dao-in-crypto-how-are-they-transforming-governance-in-digital-age/