


Serving as the cornerstone of technical analysis, Elliot waves have become nothing short of a sensation among financial traders. The theory was developed by an American accountant named Ralph Nelson Elliot in the 1930s after he analyzed more than 70 years of stock market data. While Elliot put together this theory by assessing the stock market, it is perfectly applicable to all financial markets including forex.
Here we will delve deeper into the Elliot wave theory, explore its components, and overview its real-chart example.
What is Elliot Wave Theory?
Nelson Elson first shared his ground-breaking, Elliot wave theory in the book named “The Wave Principle”.
According to him, the markets move in “repetitive patterns” due to the back-end crowd psychology and outside factors. He explained that the upward and downward price swings termed “waves,” consistently follow a distinct rhythm and are driven by the prevailing sentiments of the masses. Similar to the repetitive and timely movements of ocean waves, financial price movements also follow a predictable pattern.
According to the theory, if you successfully spot these market waves, it’s possible to make informed predictions about where the price may move next. This technical analysis technique can help you identify the market bottoms, tops, or the exact points where the direction could reverse.
In simple words, Elliot deduced that although the stock markets (or any other financial market) may appear disordered and chaotic, they are, in fact, structured and patterned. By studying the market patterns as defined by this theory, traders can speculate on the future price direction and bag potential profits.
Elliot waves – Impulse and Corrective
Now, let us look at the two types of waves that are part of the Elliot wave theory.
According to the theory, a trending market proceeds as per a 5-3 wave pattern. It means there are 5 waves, called impulse waves, in the first part of the pattern while there are 3 waves, called corrective waves, in the last part of the pattern. The last part-corrective waves are generally named A, B, and C.
Impulse waves
Waves 1, 3, and 5 of impulse waves are also termed “motive waves” as they assume the same direction as the overall trend. On the other hand, waves 2 and 4 retrace back to the opposite direction of the dominant trend and are called “corrective waves.” (They are NOT the corrective waves of the last part of the Elliot wave. The ABC corrective waves are separate and will be discussed in the next section)
For a clearer understanding, the following is an ideal representation of the 5-wave bullish impulse pattern. The same pattern is inversed in the case of a bearish market.
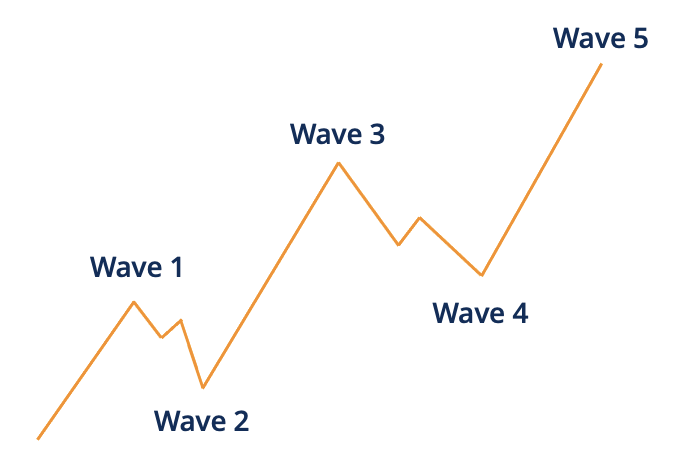
Here is what each wave represents:
(We have considered the scenario of a “bullish” Elliot wave that forms after a downtrend)
- Wave 1: It stipulates that a new trend is on the horizon as the past trend has almost ended. Wave 1 appears quite spontaneously when the asset is deemed under-priced and people start to buy. Be aware that identifying this wave may pose a challenge as it forms in close proximity to the previous trend waves.
- Wave 2: It indicates the first retracement from wave 1 in the direction of the past trend. It appears when the people, who were part of the previous cycle, move their money out of the market on signs of a trend reversal. This action causes the asset’s price to be dropped, hence causing the pullback in form of wave 2. Remember that wave 2 can NEVER advance beyond the starting point of wave 1.
- Wave 3: Wave 3 represents the period when an asset has caught public attention and the majority of people jump in to buy it. Consequently, it is the strongest wave of the Elliot pattern that easily surpasses the high point of wave 1. Note that wave 3 can NEVER be the shortest Elliot impulse wave.
- Wave 4: It is another retracement wave of the pattern, signaling that the “euphoric” price surge phase is over. Typically, wave 4 exhibits ambiguity and weakness as there is a tug-of-war between those who are still bullish and those who are exiting the market. Know that wave 4 can NEVER reach the same price zone as wave 1.
- Wave 5: This particular wave denotes the final spike in buying activity before a new trend emerges. It is the last wave in the direction of the present trend, after which the ABC corrective phase begins.
Remember that one of Elliot waves will always be “extended.” Generally, it’s wave 3 but it can also be wave 1 or wave 5.
Corrective waves
After the 5-wave completion, the trend is reversed via 3 counter-waves, known as corrective waves. Here is what the corrective waves – ABC – look like in the case of both bearish and bullish trends.

According to the Elliot wave theory, there can be up to 21 types of ABC patterns. However, you just need to remember their 3 basic formations as all the ABC patterns exist as variations of these 3 trajectories.
Zigzag
The Zigzag ABC pattern is quite a sharp price move against the preceding impulse wave trend. Typically, wave B tends to be the shortest relative to waves A and C in this scenario.

Flat
As the name indicates, flat corrective waves enact a sideways formation. In this case, all the waves – A, B, and C – are normally equal in length, though it is not set in stone.

Triangle
Triangle ABC formations can be shaped like an ascending, descending, symmetrical, or open triangle. This pattern typically includes 5 sideways flowing waves, out of which 3 (A, B, C) are part of the corrective phase.

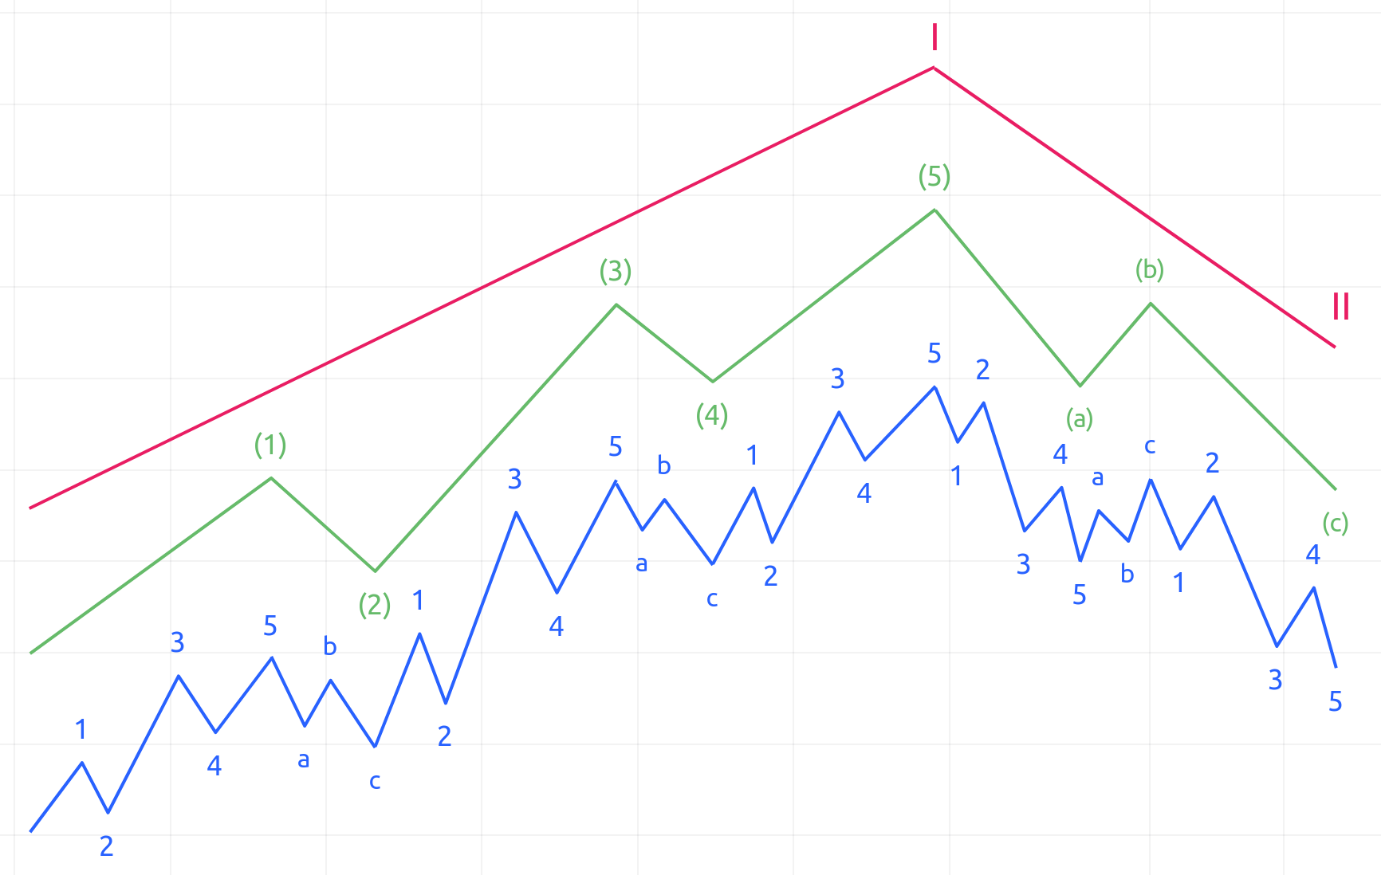
Here’s what the complete Elliot wave picture looks like according to the theory presented by Nelson Elliot.

Moreover, note that Elliot waves are “fractals” where each wave may be broken into further 5 or 3 wave patterns. Simply put, Elliot waves can be split into many smaller Elliot waves.
A real example of implementing Elliot Wave Theory – XAUUSD
Below is an illustration of a recent successful Elliot wave analysis on a XAUUSD 4-H chart. As you can see, the bullish impulse waves completed their full course, offering the market players many trading opportunities. Know that traders generally utilize Fibonacci retracement levels to determine the potential pullback points of waves 2 and 4.
Next, a zigzag corrective wave was formed in the opposite direction of the preceding bullish trend. What followed was a new bearish trend and the start of a fresh Elliot wave.

All in all, Elliot wave theory allows traders to strategically approach the markets and capitalize on the repetitive price waves. While the Elliot waves may appear somewhat complex on actual price charts, with diligent analysis and regular practice, you can enhance your ability to identify them.


