


Harmonic patterns come under the ambit of technical analysis and help traders predict future price directions to maximize their potential gains. Contrary to the standard price action formations, harmonic patterns are considered significantly advanced due to their strict conditions. These patterns materialize according to hard and fast rules and accurate measurements, making trading more objective than subjective.
Here, we have explored what exactly are harmonic patterns, which rules define them, and the four most popular harmonics utilized by currency traders.
What are harmonic patterns?
Harmonic patterns are geometric price patterns that integrate precise price levels and turning spots according to Fibonacci numbers. Most harmonic patterns are shaped by “four price moves or legs” based on fixed retracement and extension levels.
Harmonic trading takes advantage of the mathematical ratios (Fibonacci) and inputs them into price patterns assuming that these precise formations are regularly repeated. It should be noted that Fibonacci levels are respected by almost all natural and man-made products; hence they are also found within the financial markets.
Moreover, as with all other strategies, harmonic patterns should only be traded when they are completely formed. Occasionally, traders identify an in-progress pattern that seems like a harmonic formation and jump to place positions. But eventually, it might not be harmonic due to non-aligned Fibonacci ratios upon completion. Hence, traders must utilize Fibonacci tools or automatic software for identifying the correct harmonics where any discrepancy in lengths or degrees would turn the setup invalid.
The four most prominent harmonic patterns
There is a wide range of harmonic patterns that emerge on price charts with slightly different ratios and magnitudes. They exist in both bullish and bearish versions, indicating an upcoming rise or fall in prices. Here we have explained the most popular Gartley, Bat, Butterfly, and Crab patterns.
1. Gartley pattern
Gartley is one of the most recognized harmonic patterns, initially mentioned by H.M Gartley in his book “Profits in the Stock Market.” Like all harmonic patterns, Gartley is composed of four legs, namely XA, AB, BC, and CD.
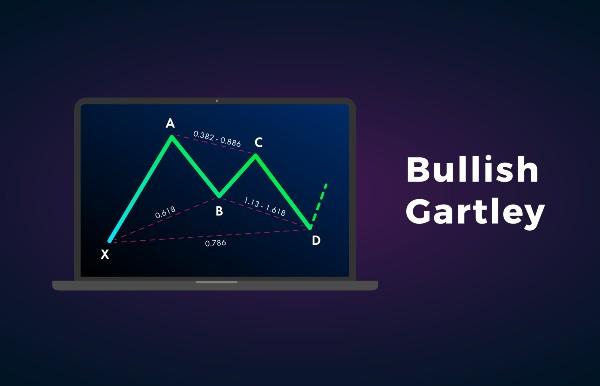
The bullish Gartley indicates the initiation of a fresh upward trend after its last point, D, whereas the bearish one stipulates an emerging bearish trend after the D point. For illustration, let us look at the exclusive geometry of a Gartley pattern:
(We are considering a bullish Gartley here)
- First is the XA wave formed by any upward price movement.
- Next, the price is corrected at point B by 0.168 Fibonacci – forming the AB wave.
- The price then again ascends, chalking out the leg BC, which is a 0.328 to 0.886 retracement of AB.
- The final move is via CD when the price moves down as a 1.13 to 1.618 extension of BC.
- Point D stands at a 0.786 retracement of XA.
Point D is the relevant area for traders, from where the price could potentially reverse to a bullish direction.
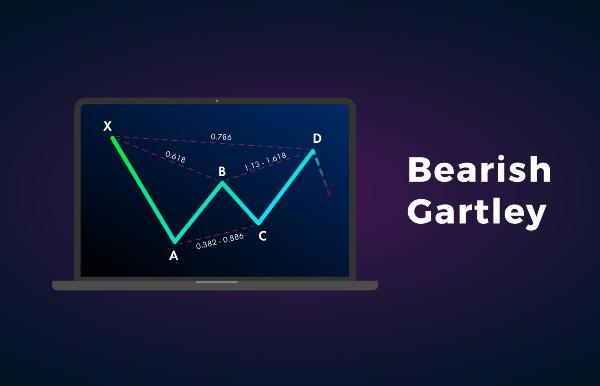
The bearish Gartley also includes the exact same measurements but in opposite directions. Traders can short at point D on the completion of the pattern.
2. Bat pattern
Discovered by Scott Carney, the bat pattern is visibly quite similar to the Gartley formation, but it incorporates different measurements than the latter. Here are the precise Fibonacci levels associated with the bat pattern:
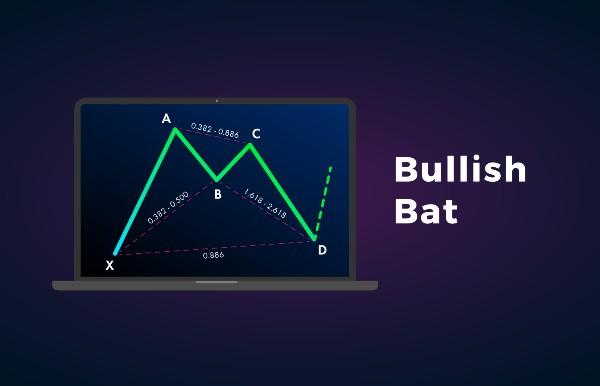
(We are considering a bullish bat pattern here that appears as a stretched-out “M”)
- Any upward price move is termed the XA leg.
- The price then retraces from point A to a lower point B by 0.382 to 0.5 of XA, enacting the AB leg.
- Next, the price proceeds upward, forming the BC wave, following a 0.382 to 0.886 retracement of AB.
- CD is the final leg where the price moves downward with a 1.618 to 2.618 extension of BC.
- Point D should indicate a 0.886 retracement of XA.
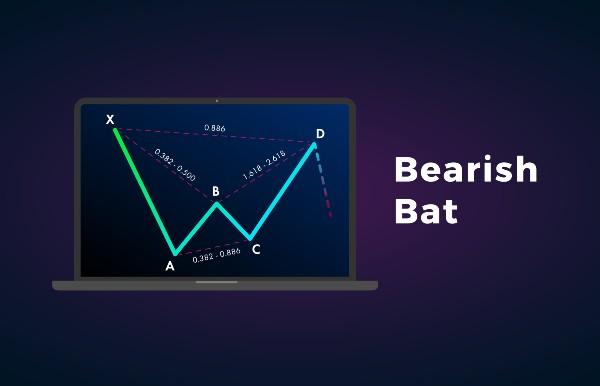
Bearish bat integrates the similar ratios as mentioned above, but the setup is reversed, manifesting a sort of stretched-out “W”). D is the entry point for traders to place their bullish or bearish trades.
3. Butterfly pattern
Similar to other harmonic patterns, a butterfly also includes four price moves, but here the D point extends beyond X. Let us look at the geometric proportions applicable for the butterfly pattern.
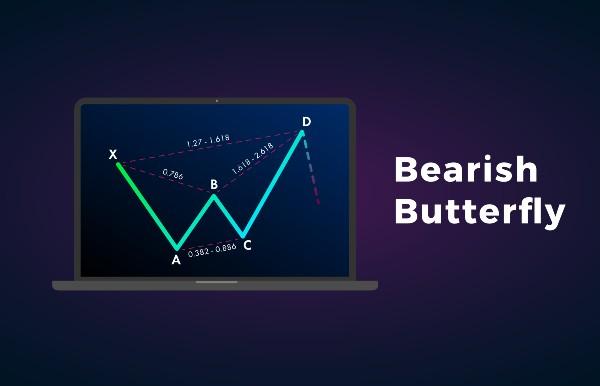
(We are considering a bearish butterfly pattern for illustration)
- The formation starts with the XA wave, formed by descending price movement.
- Next, the price moves upward at point B with a 0.786 retracement of XA, establishing the AB leg.
- From B, the price again moves down and forms BC, which shows 0.382 to 0.886 retracement of AB.
- Lastly, the price moves opposite to BC, developing the CD leg via extending 1.618 to 2.24 of BC.
- D is at a higher position than X with a 1.27 extension of the XA wave.
On the completion of a bearish harmonic butterfly, traders can place a short trade at point D. Conversely, point D is considered for long positions when a bullish butterfly is formed.

4. Crab pattern
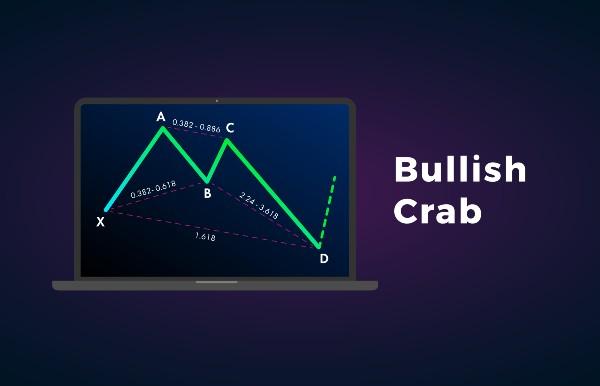
The crab pattern appears quite similar to the butterfly pattern as its final leg (AD) also stretches beyond X. This sideways extended butterfly-like pattern incorporates the following Fibonacci levels:
(We are considering a bullish crab here)
- As with all harmonic patterns, the first upward price move is indicated by XA.
- Afterward, the price is retraced to a lower point B by 0.382 to 0.618 of XA, forming the AB leg.
- The next upward BC wave is a 0.382 to 0.886 extension of AB.
- The final CD leg is 2.168 to 3.618 retracement of BC.
- Point D should be a 1.618 extension of XA.
Traders can enter a bullish trade when the price shows signs of upward momentum from point D.
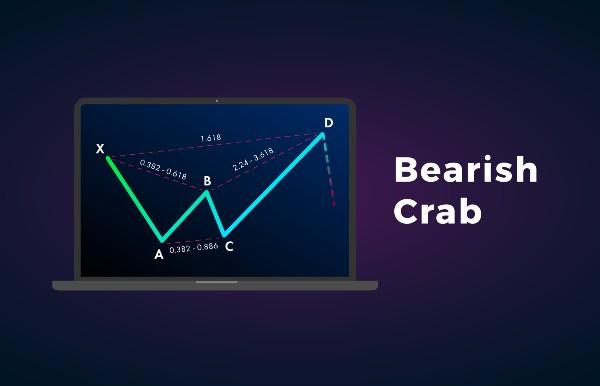
Bearish crab assimilates the same Fibonacci ratios, but the setup is flipped opposite and starts from a downward XA price wave.
Closing thoughts
Harmonic trading proffers an impressive and accurate way of trading, but it needs to be proficiently learned and practiced for devising actual gains from it. Traders must understand that precise measurements are the hallmark of harmonic patterns, and any deviation from these ratios can turn the trading system invalid. Moreover, like all other trading setups, harmonics are not foolproof. Hence, it is essential to implement proper risk management measures in case the price does not move in the expected direction.
Read more:
https://thetradingbay.com/best-forex-chart-patterns/
https://thetradingbay.com/5-best-strategies-in-intraday-trading/


