The majority of forex traders rely on an array of technical indicators and tools to enhance their trading performance. Among these essential elements, Bollinger bands emerge as a paramount indicator capable of empowering market participants to fine-tune their strategies and achieve superior outcomes.
In this Bollinger bands trading strategy guide, we are going to explore what these bands are and how you can employ them to identify more efficient trade setups.
What are Bollinger bands?
Developed by John Bollinger, Bollinger bands is a technical indicator that provides information regarding market volatility and specifies potential “overbought” or “oversold” price zones. As part of their ability to gauge volatility, Bollinger Bands automatically adapt according to the shifting market conditions: the contraction of the bands indicates a quiet (non-volatile) market, while their expansion indicates a lively (volatile) one.
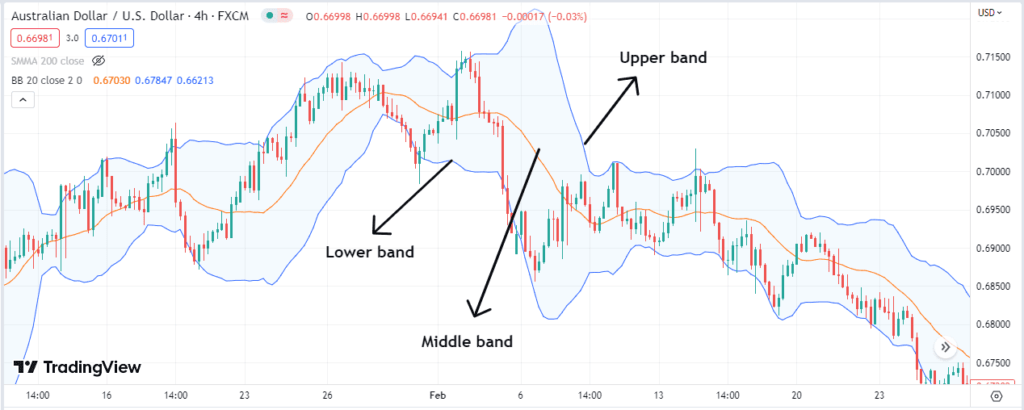
The usual representation of Bollinger bands includes three distinct lines, namely the upper band, the middle band, and the lower band.
- The upper band is determined by adding 2 standard deviations to the middle band.
- The lower band is calculated by subtracting 2 standard deviations from the middle band.
Regarding the concept of standard deviations, it serves as a measure of the dispersion or spread of numbers. When the upper and lower bands are set at 2 standard deviations, it implies that approximately 95% of recent price movements are encompassed within these bands.
- Lastly, the middle band is established by employing a 20-period Moving Average.
Most charting programs furnish Bollinger bands with a 20-period Moving Average, which is generally suitable for most traders. However, it is possible to manually set this MA to any other period as per your suitability.
When the price nears the upper Bollinger Band, it is deemed “expensive” as it surpasses the average by 2 standard deviations, which is calculated based on the 20-period moving average.
Conversely, when the price nears the lower Bollinger Band, it is regarded as “cheap” since it falls below the average by 2 standard deviations, as mentioned above.
Bollinger bands trading strategy: Bollinger bounce with confluence
Typically, the price tends to return toward the middle band, a process known as the Bollinger bounce, equipping traders with opportunities to capitalize on these bounces.
However, it is crucial to pay attention to the width of the bands and not blindly buy low and sell high. If the bands are expanding, it is advisable to steer clear of executing the Bollinger bounce approach, as this typically indicates that the price is experiencing a trend. During trending markets, prices can stay “inexpensive” or “costly” for an extended duration, rendering the Bollinger bounce strategy useless.
Rather, focus on identifying a “ranging market with stable or even contracting bands” to apply this Bollinger bounce technique effectively.
Moreover, try to look for a confluence of factors to enter an inherently more reliable trade. For instance, you can strive to identify relevant candlestick patterns or resistance/support levels that fit together with the upper/lower Bollinger band.
Example
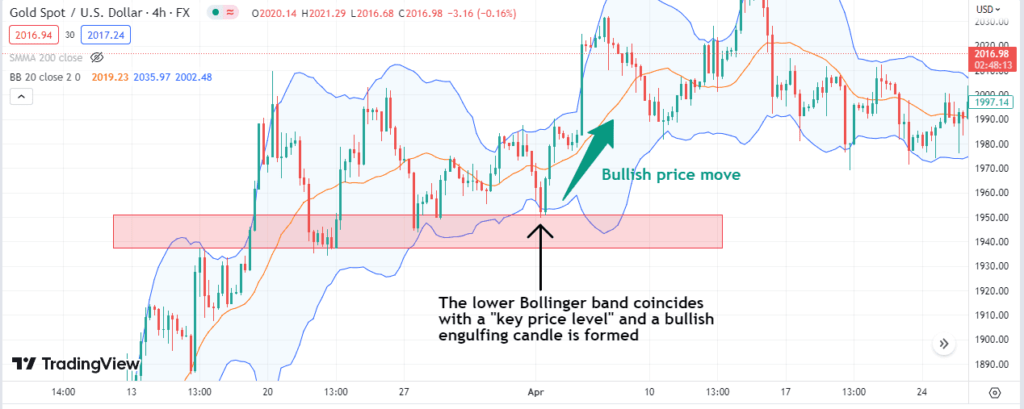
In the XAU/USD 4-H chart below, we have applied Bollinger bands with the default settings. To specify an optimal trade entry, we managed to notice a confluence of different factors along with the lower Bollinger band.
As you can see, the price displayed an upward momentum from an area marked by 3 confluence elements: support zone, bullish engulfing candle, and Bollinger lower band. The area identified by the black arrow is potentially ideal for a high-probability “bullish” trade entry.
Bollinger Bands trading strategy: Breakout trading
When the Bollinger bands compress, it signifies that the market is experiencing a period of low volatility, and this pattern often indicates an impending breakout. The reason behind this is that volatility tends to expand following a period of contraction – markets regularly transition between periods of high volatility and low volatility.
In the event that the candlesticks begin to exceed the upper band after a breakout, the upward trend is likely to persist.
Conversely, if the candlesticks breach the lower band as part of the breakout, the price is expected to decline further.
Example:
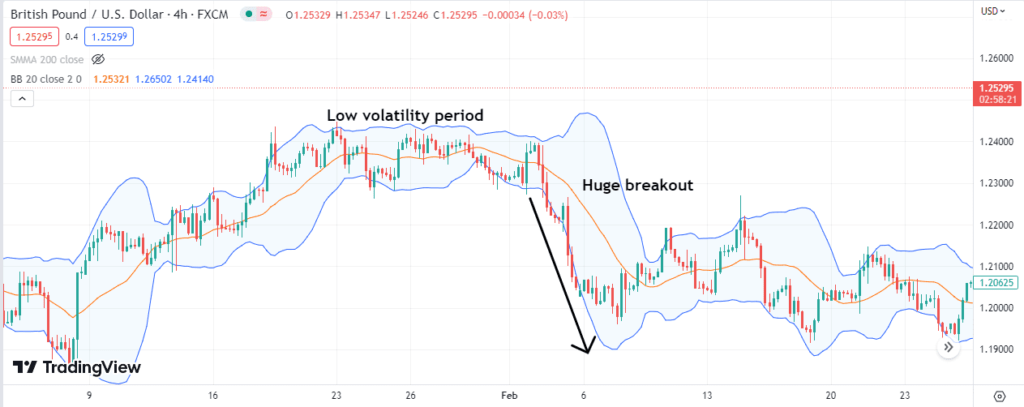
In the GBP/USD 4-H chart below, we have demonstrated the “Bollinger squeeze and breakout” trading strategy.
Note that during the low volatility period, the Bollinger bands remained in a compressed state. With the price breakout in a downward direction, the bands expanded, indicating an elevation in market volatility. The setup presented a “bearish” trade opportunity as the price continued to decline amid dilating Bollinger bands.
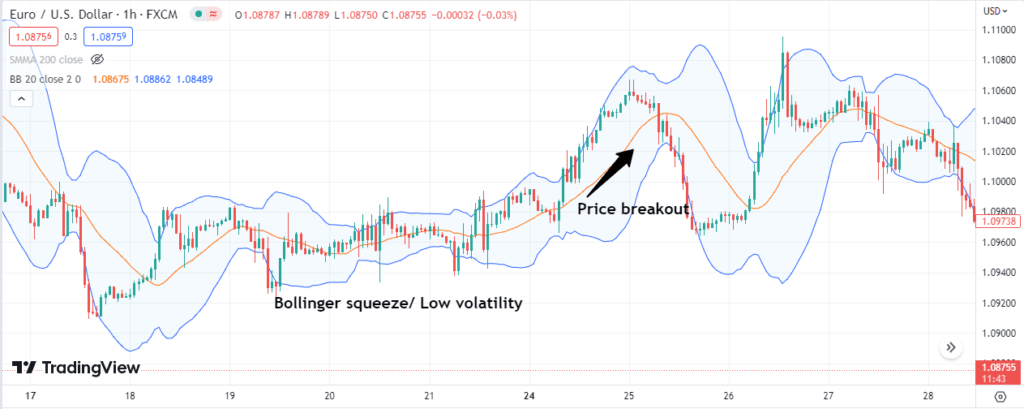
The following chart shows another example of the Bollinger bands breakout strategy but in the bullish direction. In the EUR/USD, 1-H layout below, notice that the market remained in a low volatile condition for some time, as indicated by the bands’ squeeze. Eventually, the price broke out in an upward direction, denoted by the broadening of upper and lower Bollinger bands.
Bollinger bands trading strategy: Trend trading
The middle line of the Bollinger bands represents the 20-period moving average, which is essentially the average value of the Bollinger bands. Moreover, in trending markets, the 20-period moving average is typically a significant reference point traders use for trading with the trend.
Consequently, when the market experiences a pullback towards the 20-period moving average of Bollinger bands, it can be a favorable opportunity for you to consider taking a long or short position.
Example:
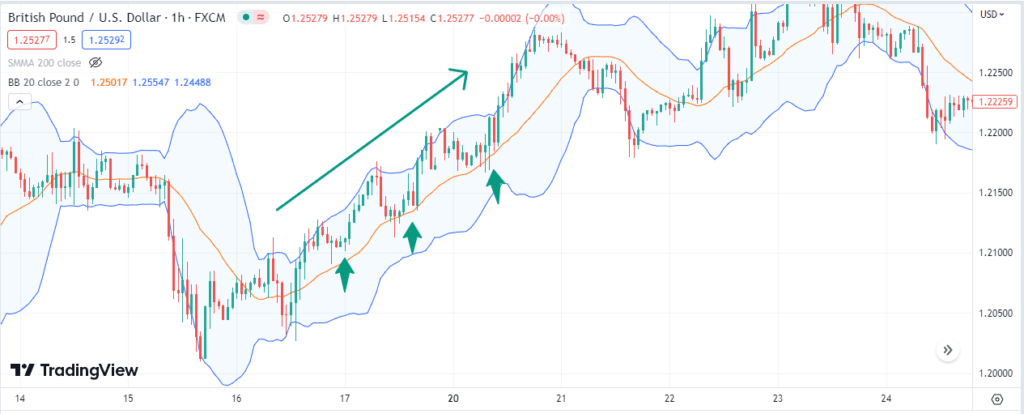
In the GBP/USD 1-H chart below, you can see that the market assumes an upward trajectory. Several bullish trade opportunities can be observed here as the price kept bouncing from the middle band to rise further. To put it simply, the price remained expensive for some time, offering a trade entry point each time the price hit the middle 20-period moving average.
Bollinger bands with RSI divergence
RSI serves as a technical analysis tool that evaluates the speed and momentum of price fluctuations. Its purpose is to compare recent gains against recent losses in order to determine whether an asset is excessively purchased or oversold.
By combining RSI divergence with Bollinger bands, you can optimize your trade entries. A regular RSI divergence arises when the price on the chart moves in the opposite direction of the RSI, signaling a shift in momentum prior to a corresponding price reversal.
A bullish divergence takes place when the RSI exhibits an oversold reading, followed by a higher low while the price keeps forming lower lows. This divergent pattern suggests an upsurge in bullish momentum: a price breakout in the upward direction could be considered as a trigger for opening a long position.
On the other hand, a bearish divergence occurs when the RSI reaches the overbought zone, followed by a lower high, while the price forms higher highs at that same point.
When using RSI with Bollinger bands, if the price is positioned near the upper band, observing a bearish RSI divergence can indicate weakness in the ongoing trend and an impending bearish reversal.
Alternatively, when the price approaches the lower band, identifying a bullish RSI divergence may signify an upcoming bullish reversal.
Example:
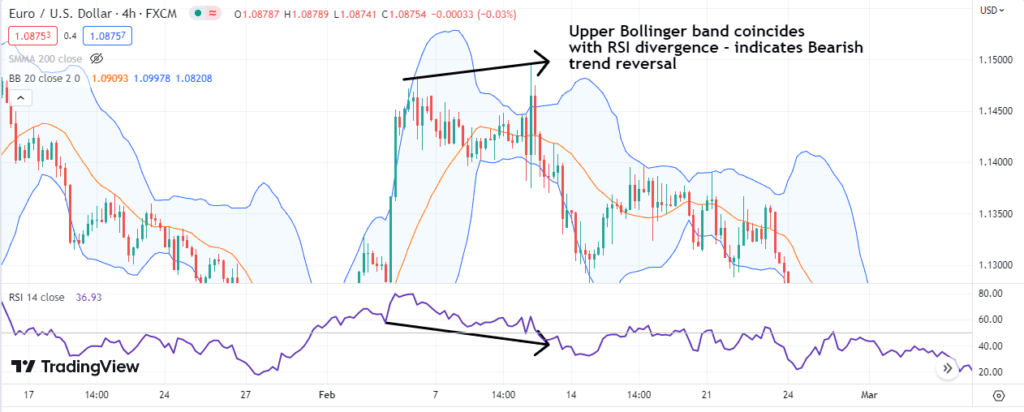
In the EUR/USD 4-H chart below, we have implemented Bollinger Bands and RSI indicators with default settings. You can observe that a bearish RSI divergence emerges on top where the higher high of price corresponds with the higher low of RSI. Most importantly, this pattern has formed when the price exhibits movements around the upper Bollinger band.
The confluence of RSI divergence with the upper Bollinger band indicates a potential bearish reversal, presenting traders with the opportunity to capitalize on the downward price flow.
Final thoughts
Besides the strategies highlighted in this Bollinger bands trading strategy guide, numerous other methods also exist that you can utilize in conjunction with Bollinger Bands to optimize your outcomes. However, it is advisable to initially experiment with the indicator on a simulated trading account and observe the results before implementing it in live trading. Try to analyze the manner in which prices move in relation to the trio of bands.
Nonetheless, regardless of your proficiency level and skills, never trade without a proper risk management plan.
Read more: