

Considering the extent of competition in the forex trading space, traders must carefully determine their approach and adopt well-suited strategies to stay ahead of others. An effective trading strategy can help market participants adeptly analyze market movements and enter positions accordingly.
In this article, we have specifically discussed some of the simplest and best trading strategies for traders who are new to this field. At this point, note that working with simple trading strategies does not imply that you’d get below-par results, similar to how using complex forex systems does not guarantee a good outcome. Simply put, results define success in the forex trading arena – no matter whether they are achieved via a simple beginner-level strategy or some highly complicated structure.
Now, let us look at the top 5 forex trading strategies for beginners, that are not only easy to implement but are also widely acknowledged by market experts globally.
1. Price action trading strategy
As the name suggests, the price action trading strategy relies on the “price action” or bare movement of price on charts instead of technical indicators. It revolves around some common price patterns that frequently appear on charts, indicating the points of trend continuation or reversals.
According to this method, traders can enter positions upon detecting formations like triple tops/bottoms and head & shoulders (reversal patterns) and flags/pennants (continuation patterns). You can apply this simple strategy on any timeframe, though it works better with larger timeframes, like 1-H and so on.
Example
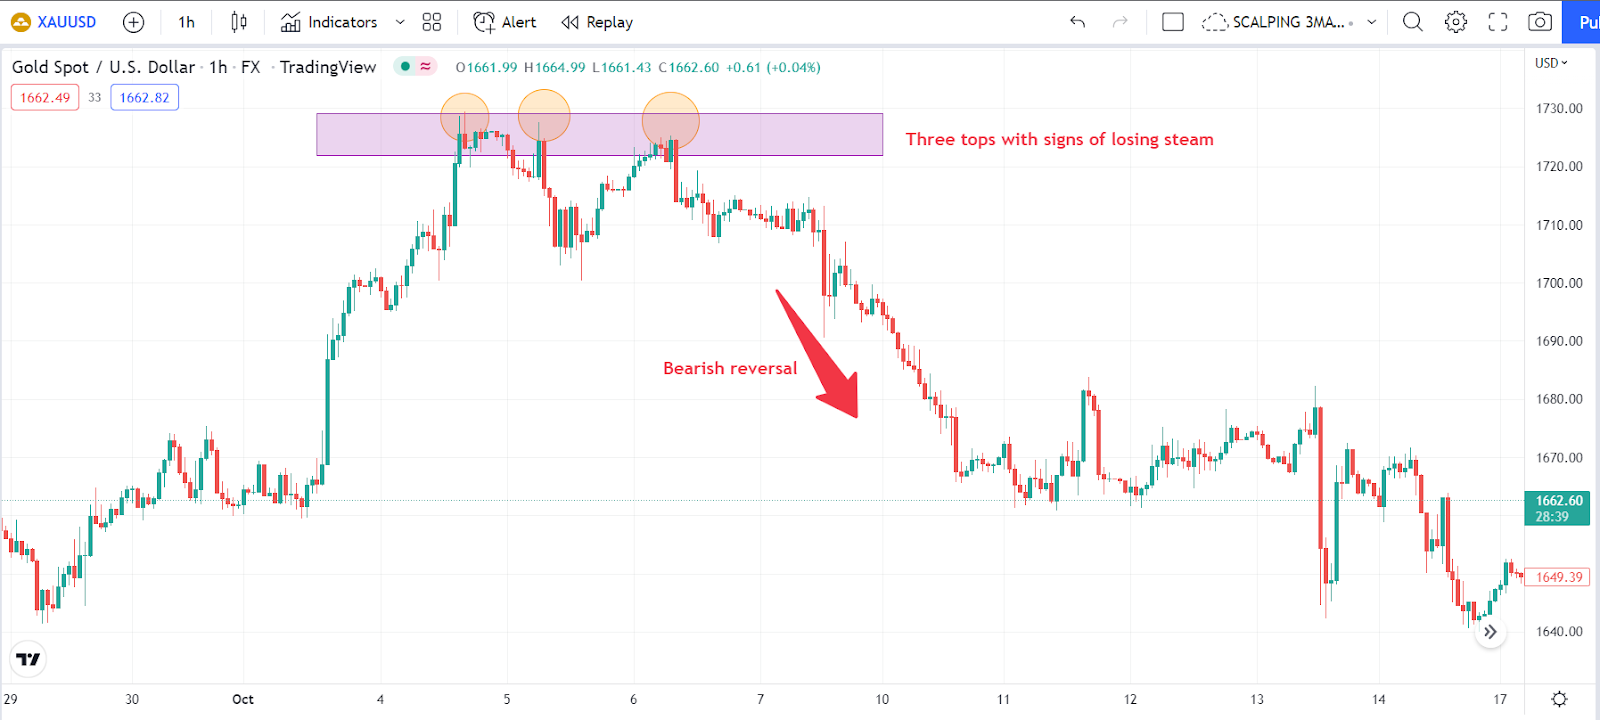
Below, we have illustrated the price action trading strategy on the XAUUSD 1-H chart. We spotted subsequent price rejections from a resistance zone at the potential end of a bullish trend. The price was rejected three times, enacting a triple top pattern, while also losing steam with every bounce.
Upon identifying such a pattern, traders can place a “bearish” position on the third price rebound. Stop loss should be placed a little above the resistance line and TP points can be set through the Fibonacci retracement tool or manually, by observing the support levels.
2. Trend trading strategy
Trend trading may appear as an over-hyped strategy that is discussed repeatedly; however, note that the technique deserves this acknowledgment. It is because trends regularly appear on price charts offering tremendous trading opportunities.
As part of a trend trading strategy, traders can place multiple orders once the price assumes a bullish or bearish direction and respects the relevant moving averages or trendlines. However, trend trading proffers better results with a long-term approach as it minimizes the temporary market noise and generates ample returns over time. While intraday trend trading is also possible, it is comparatively risky due to a short margin of stop-loss which can be triggered upon the shortest price instability.
Also, during trend trading, proper risk management is essential to tackle the impending price reversal – that eventually happens at some point. Regarding this, traders can use trailing stop losses and multiple take profit points to protect their returns.
Example
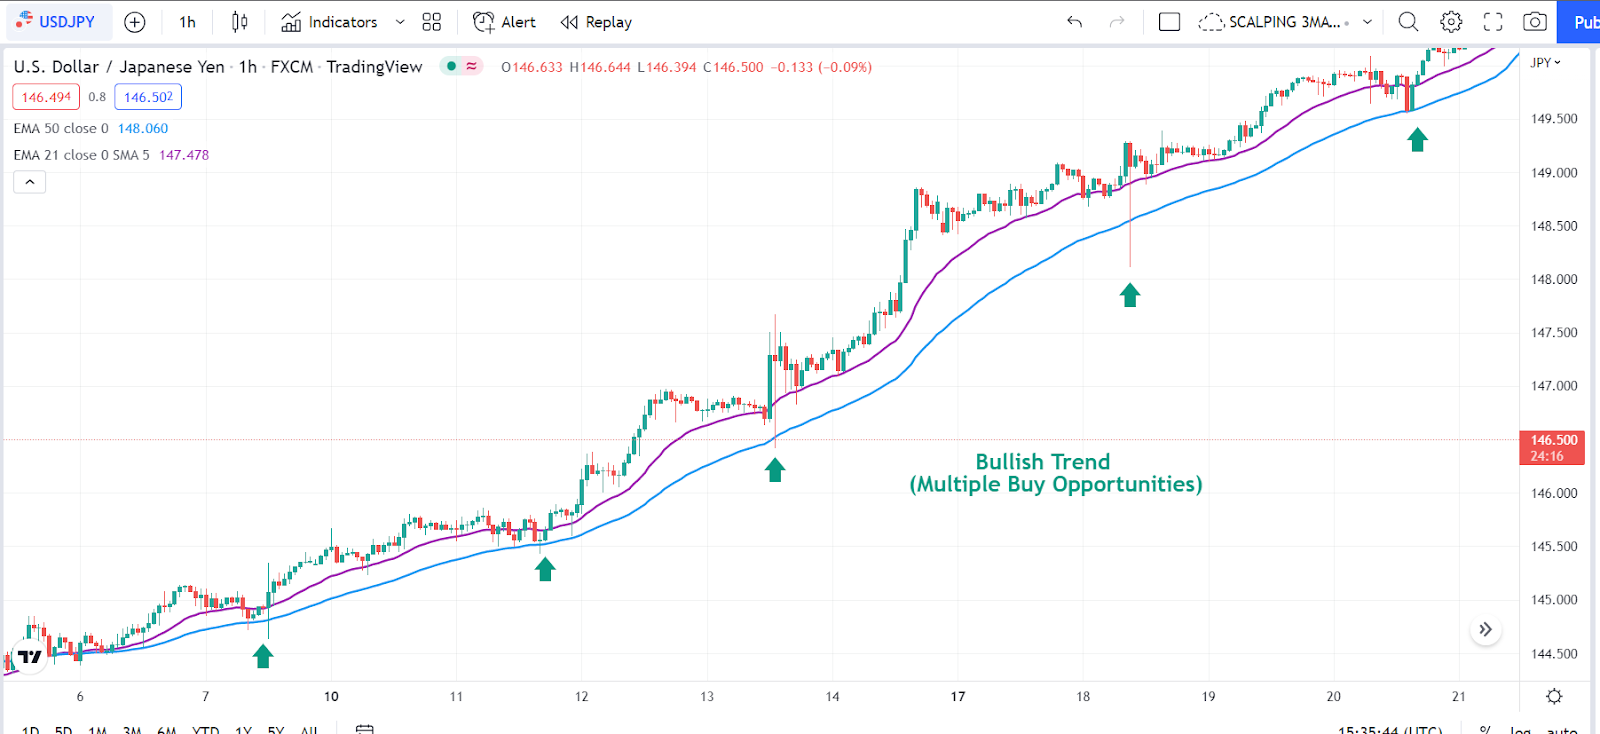
The below USD/JPY chart displays an example of a bullish trend trading setup. We have applied two exponential moving averages, 21-period and 50-period, on the price chart. The MAs function as the dynamic support for the price while it keeps moving upward.
The small green arrows indicate the potential trade entry points for short-term traders who can enter a position when the price touches 21 or 50 EMA and exit on the first sign of a rebound. Whereas swing/position traders can enter at an early point and hold their position over the long run. Placing a trailing stop loss and multiple TP points would be beneficial in this case.
3. Retracement trading strategy
Retracement trading is one of the best trading strategies for getting a good entry point on an ongoing trend. The strategy relies on market retracement where traders look for instances when the price momentarily rebounds before continuing in its original direction. Retracements are an integral part of financial markets as prices cannot continuously move in one direction. Even the strongest trends show temporary price dips or surges that are known as “corrections.”
As part of the retracement trading strategy, market players can enter a position on a short price recoil to capture the dominant trend. Fibonacci retracement is the most prominent tool used for this purpose as it specifies the likely areas of retracement. 38.2, 50, and 61.8 are the most tested ratios trusted by worldwide traders. That said, a price rebound beyond the 61.8% zone is usually considered “a reversal” and turns the retracement trading setup invalid.
Example:
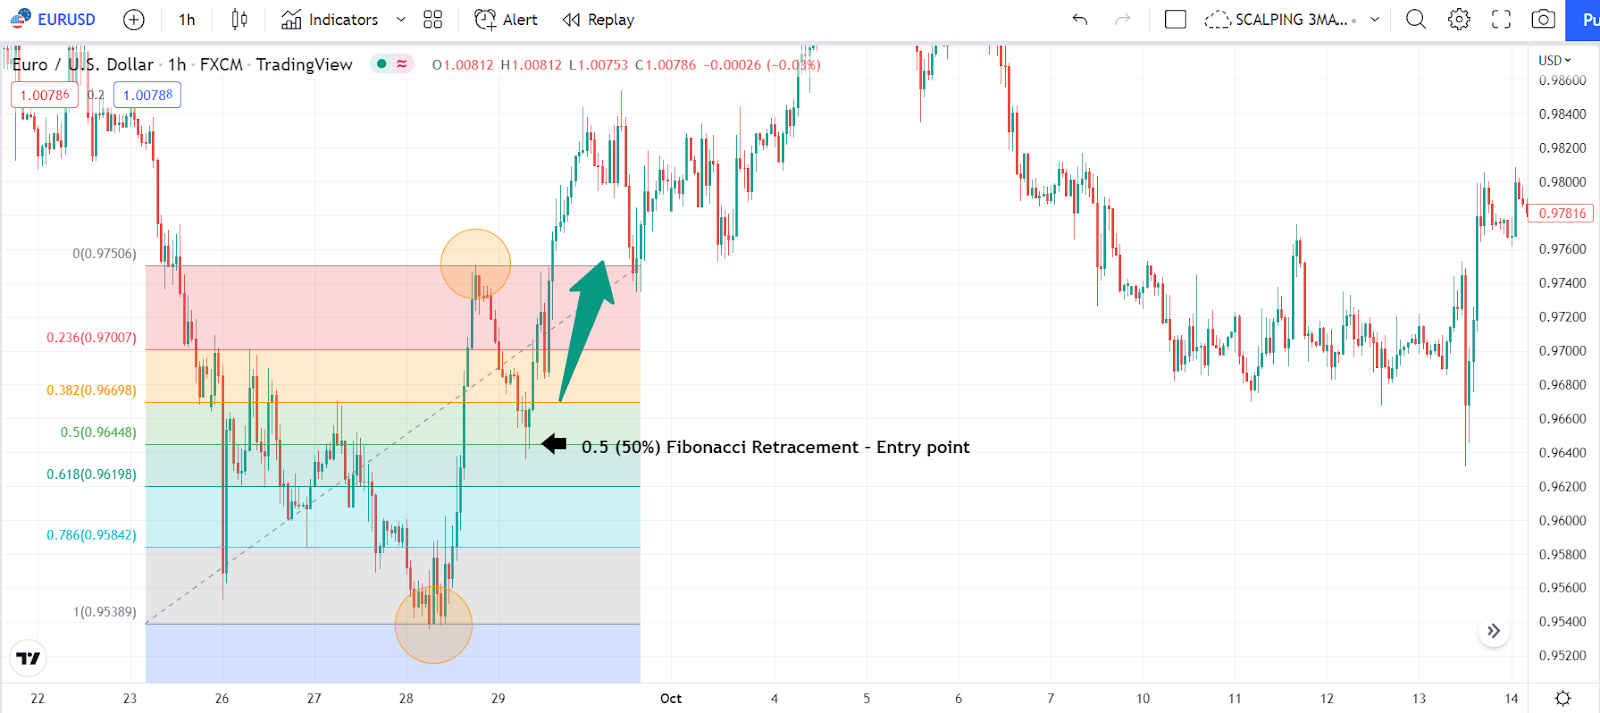
In the EUR/USD 1-H chart below, we have applied the retracement trading strategy by drawing the Fibonacci zones. The Fibonacci levels were extended between the two circled levels to catch the newly developed bullish trend at a good rebound point. As you can see, the price retraced to the 50% Fibonacci zone before resuming its upward trajectory. In this case, traders can place “buy” orders on a successful bounce from the 0.5 ratio line.
4. Range trading strategy
The range trading method is one of the simplest trading strategies that capitalize on the “support” and “resistance” zones. Many times, prices do not settle in one direction and instead bounce back and forth within a range, showing the market indecision. As per the range trading strategy, traders can take advantage of these up and down movements for acquiring potential profits.
To efficiently use this technique, traders must identify the levels respected by the price and where it is likely to bounce back. Upon drawing the two belts, both bullish and bearish trades can be placed for maximizing the returns.
Example:
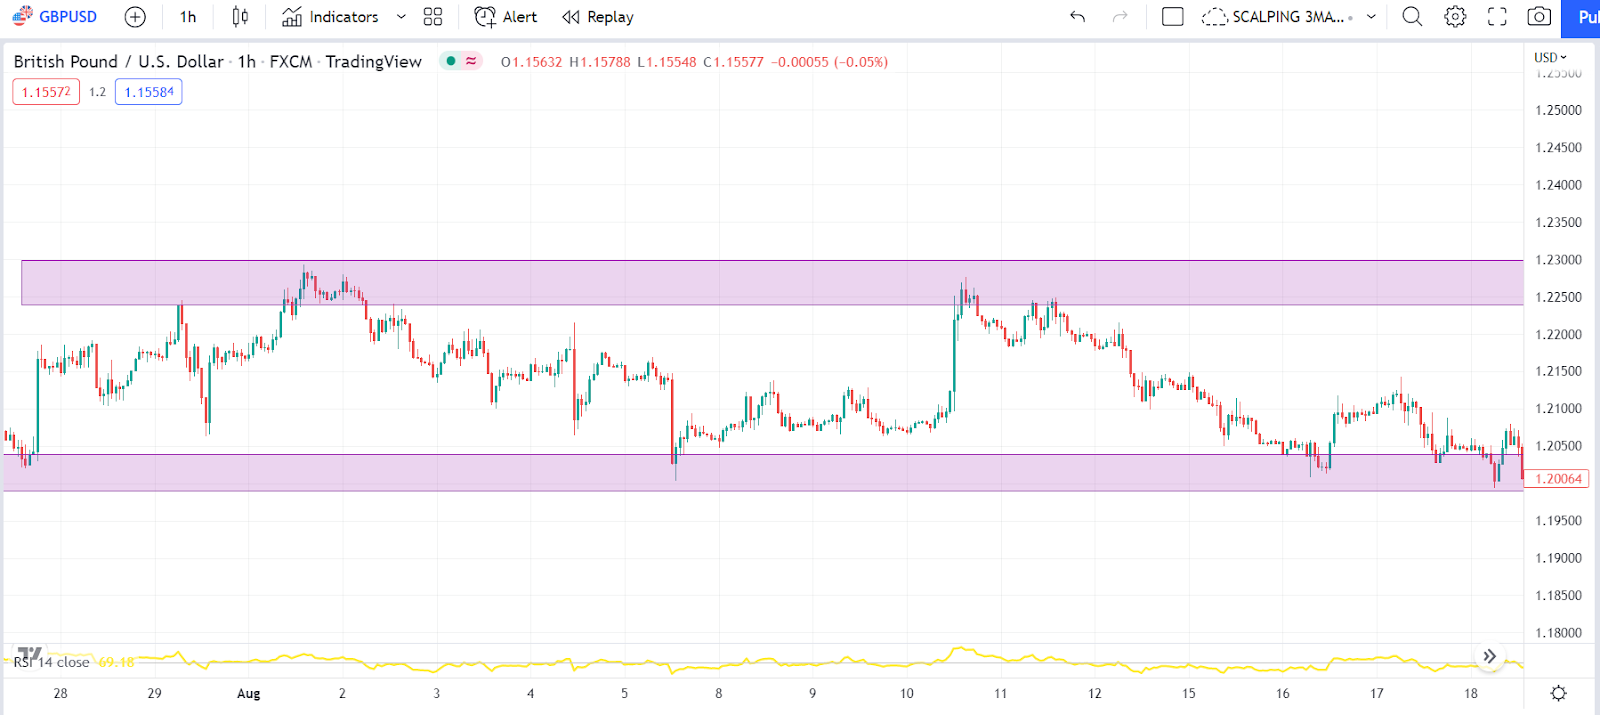
We have illustrated a range trading setup in the GBP/USD 1-H chart below. Support and resistance areas are indicated by the highlighted zones. Traders can place “buy” trades when the price touches support whereas they can place “sell” orders when the price reaches the resistance level. In this strategy, it is better to secure profits before the price lands on the next zone because many times the price changes direction mid-way or before touching the subsequent level.
5. Break out trading strategy
Breakout trading strategy is an ideal method to catch an emerging trend amid changing market sentiments. A breakout occurs when price breaches the previously maintained levels, like a range, support, or resistance. However, false breakouts are also common in the trading space where price “trap” the traders, triggers their stop losses, and reverse again. To avoid false breakouts, traders may enter a position only if a level is broken by “strong” candles and then successfully “retested” by the price.
Example:
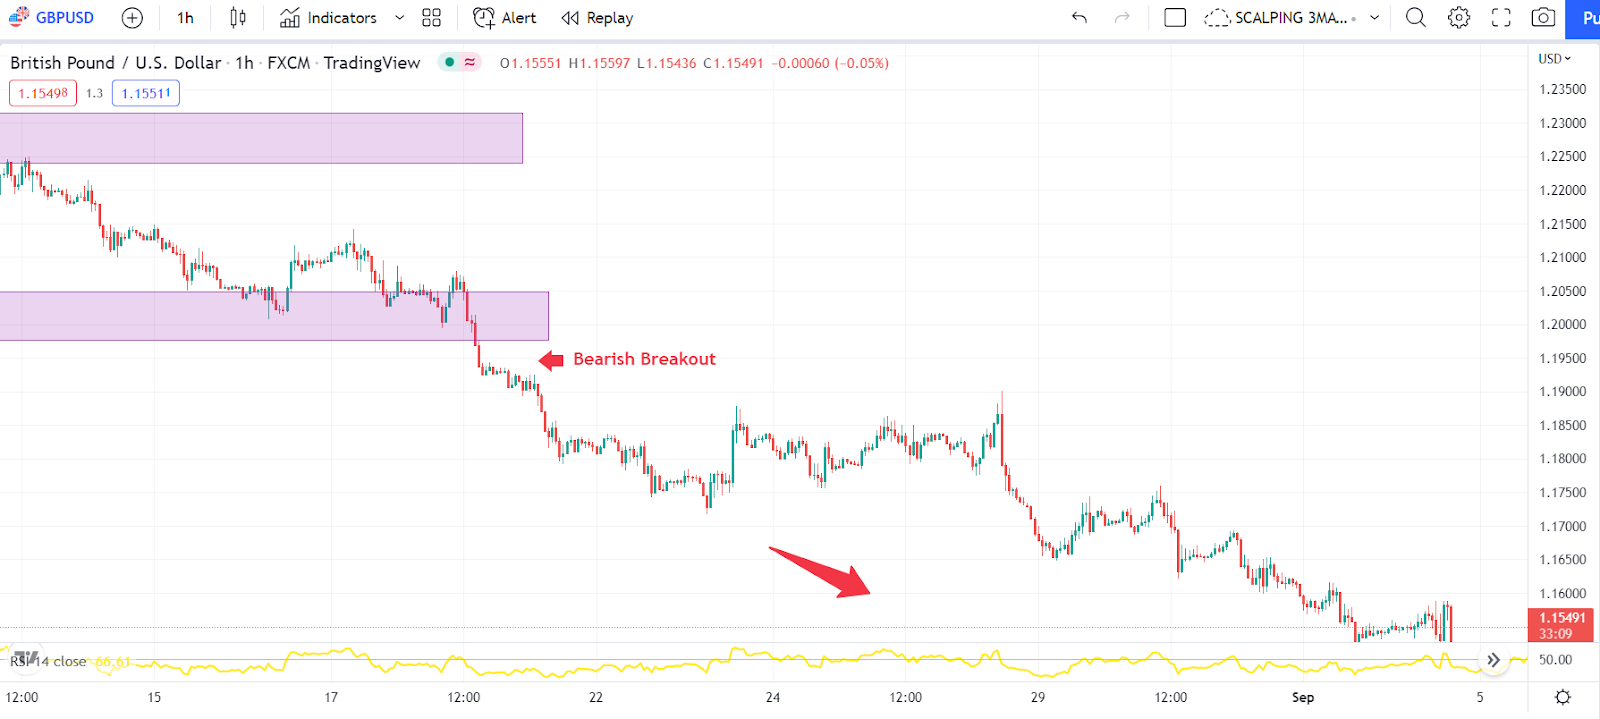
The below GBP/USD 1-H chart shows an example of the breakout trading strategy. Here, we have taken the same chart from the above illustration (range trading) to show that the range is finally broken on the downside, leading to a new “bearish” trend.
Traders can capitalize on this bearish breakout in a variety of ways. For instance, most strong and true breakouts are followed by “weak inside bars” that indicate the waning capability of price to reverse. Accordingly, a “sell” trade can be placed on the appearance of some very small inside bars after a breakout by “large” bearish candles.
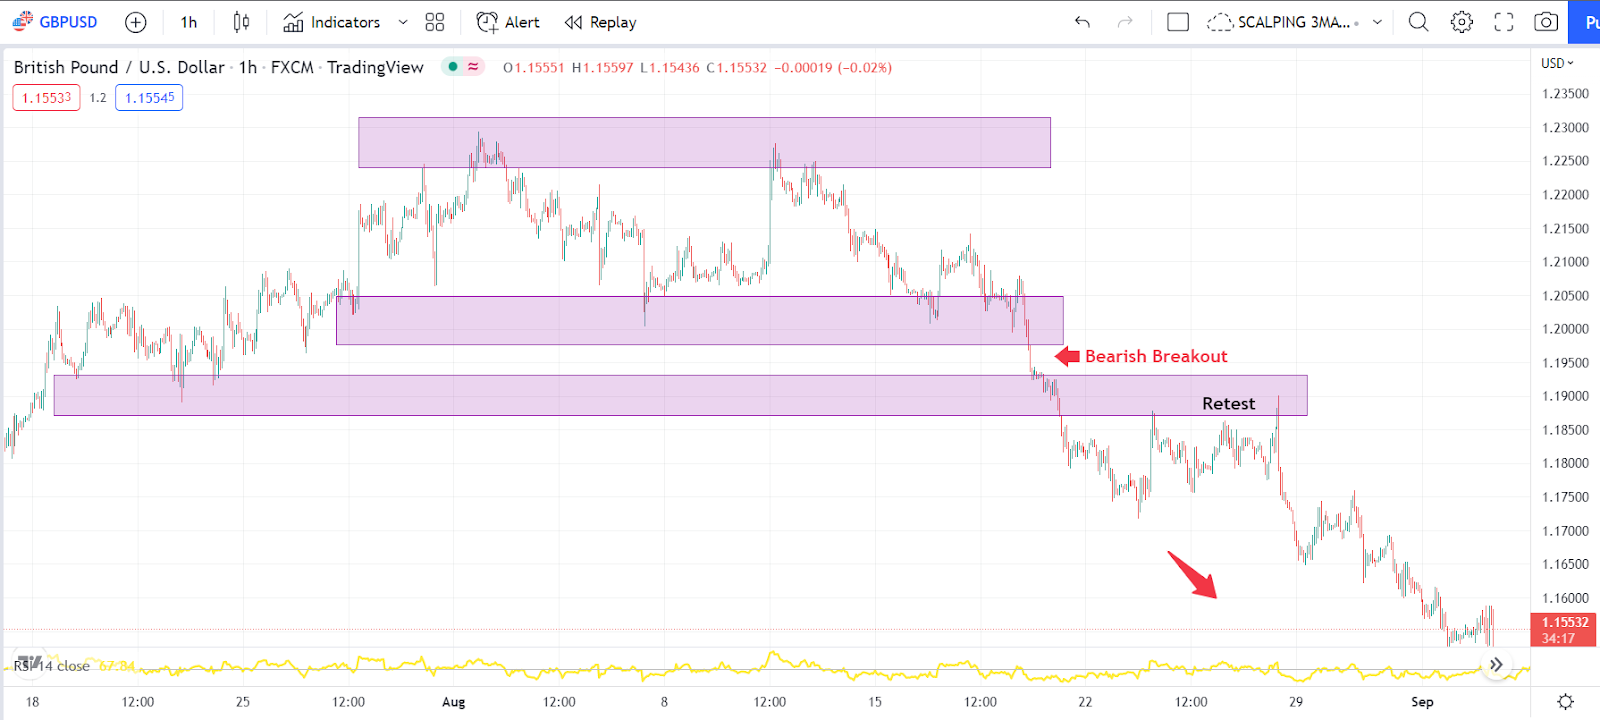
The below chart is another, zoomed-out, view of the above setup. Traders can also enter a “sell” trade when the price successfully retests a key zone. In this case, the price retests a “support turned resistance” level, offering confirmation of a true breakout.
Disclaimer: No forex trading strategy has a 100% win ratio in any way. Results can vary as per the market conditions, how efficiently a strategy is implemented, or without any apparent reason.
Read more:
http://thetradingbay.com/scalping-trading-3-best-scalping-trading-strategy/
http://thetradingbay.com/swing-trading-3-top-swing-trading-strategies/