


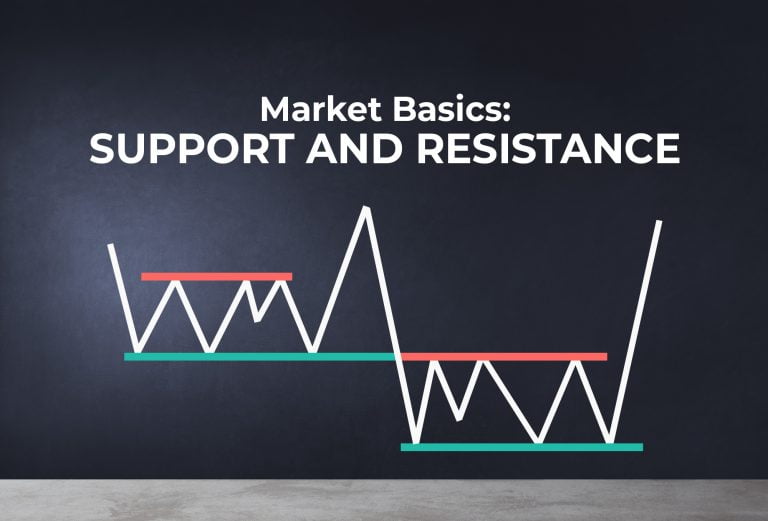
Support and resistance lines are fundamental tools in technical analysis, utilized as visual markers to delineate the levels at which a price encountered a temporary barrier, essentially where it had difficulty crossing.
In a scenario where the price ascends and then retraces, the highest point it touches before retracting is identified as resistance. Resistance levels signify areas where a surplus of sellers is anticipated, making it a zone where selling interest overcomes buying pressure, potentially halting the price from rising any further.
Conversely, when the price moves upward again after a retraction, the lowest point it reaches before this ascent is termed as support. Support levels depict zones where a surplus of buyers is present, thus an area where buying interest surpasses selling pressure, potentially stopping the price from falling any further.
As the price fluctuates over time, these support and resistance lines are perpetually formed, showcasing the ongoing battle between buyers and sellers. Although widely used by numerous traders, the variety in application and integration of support and resistance lines underlines that charting within trading is more of an art than an exact science. Through these lines, traders are better positioned to understand price trends and make informed decisions.
How to plot support and resistance levels?
Effectively plotting support and resistance lines demands a blend of precise analysis and a clear understanding of market dynamics. The following guide outlines how to accurately plot these lines on your chart.
Understanding the concept:
Recognize that support and resistance levels often manifest as areas rather than precise levels on your chart. Acknowledge that these areas depict regions where traders are more inclined to buy or sell, potentially indicating a market direction change.
Selecting the timeframe:
Preferably, conduct this task on a larger timeframe such as 4-hour charts to obtain a clearer and more reliable analysis.
Plotting the lines:
Instead of striving for a perfect alignment with highs and lows, aim for a level that achieves the most touches on either side of the line, enhancing the chance of catching a market move when it occurs. Utilize horizontal lines or zones to mark these areas on your chart, ensuring they align with multiple touchpoints where price had trouble crossing in the past.
Identifying levels:
Focus on the most conspicuous support and resistance levels that are immediately visible without an extended search. Begin by identifying levels from highs and lows that have occurred within the last six months, though it is permissible to look back further once the level is drawn.
Adjustment and analysis:
Revisit and possibly adjust the plotted lines to ensure they remain relevant with the most recent price action. Integrate other technical analysis tools or indicators to corroborate the identified support and resistance levels for a more holistic analysis.

Trading with support and resistance
Understanding how to leverage support and resistance lines can greatly enhance your trading strategy. Below is a simple yet effective guide on how to trade using these lines:
-
Trade the “Bounce”
This strategy is based on the anticipation that the price will “bounce” off the support and resistance lines rather than crossing them.
- When the price descends and approaches the support line, consider buying. The rationale is that the price will likely bounce off this level rather than continue its descent.
- As the price surges and nears the resistance line, consider selling. This is based on the expectation that the price will bounce off the resistance and start declining.
-
Trade the “Break”
This strategy involves capitalizing on moments when the price breaks through the established support or resistance lines.
- When the price continues to rise, breaking through the resistance line, consider buying. This suggests a potential upward momentum as the previous resistance might act as a new support.
- If the price drops and decisively breaks below the support line, contemplate selling. This indicates a possible continuation of the downward trend as the former support could turn into a new resistance.
While trading with support and resistance lines can be beneficial, always remember that no strategy guarantees success every time. Combining this approach with other indicators and tools, and ensuring proper risk management, can maximize the chances of favorable outcomes.
Trend lines – A dynamic support and resistance
While horizontal support and resistance levels are common analytical tools, trend lines emerge as equally significant yet distinct instruments in gauging the price trend of a financial instrument over time.
Trend lines, akin to horizontal support and resistance levels, act as barriers that prevent the price of an asset from moving in a particular direction. They differ by adapting to the asset’s price trend over a period, offering a sloped or diagonal representation of support and resistance, as opposed to the static horizontal levels. By doing so, trend lines provide a clear picture of the prevailing market sentiment, whether it is bullish or bearish, and the potential future price path.
Creating a trend line necessitates a minimal data set of two tops (in a downtrend) or two bottoms (in an uptrend) to construct a valid line. However, the rule of thumb for confirming a trend line’s significance and reliability is witnessing it tested at least three times.
The more times a trend line is tested without being broken, the stronger and more significant it becomes in portraying the robustness of the existing price trend. Each test reinforces the trend line’s status as a boundary of price action.
Bottom line
Support and Resistance are central ideas in the trading arena, marking key spots where market forces of buying and selling clash to define the coming price tags of assets. They lay down the basic framework for market players to judge market vibes, evaluate possible trend shifts, and smartly pick when to step in or step out. By getting a good grip on the twists and turns of support and resistance, traders can gear up to dissect price shifts with a keen eye, thus upping their game to pull off more pleasing trade results.
Read More:


