
Supply and demand are foundational concepts that drive price fluctuations across various markets. In the intricate realm of foreign exchange trading, these principles remain equally paramount. Mastering the nuances of supply and demand can offer traders valuable insights into potential shifts in currency prices.
In this article, we will explore what exactly is supply and demand in forex, how to identify these zones and some prominent supply and demand forex trading strategies.
What is supply and demand in forex?
The Forex market, like any other market, operates on the principles of supply and demand. These principles dictate how currencies move concerning one another, generating significant price patterns on market charts.
The basics of supply and demand:
- Demand: Represented by buyers, demand signifies how much of a particular financial instrument people want. An increase in demand typically pushes the price of the instrument higher.
- Supply: Represented by sellers, supply indicates how much of the financial instrument is available. An increase in supply usually pushes the price of the instrument lower.
Consider the scenario where a company releases a new car. If the supply of cars exceeds the number of interested buyers at the set price, the price will have to decrease. The price will keep dropping until it reaches a point where buyers are willing to purchase. On the other hand, if there are more buyers than cars available, competition among buyers will push the car’s price upwards.
In the forex market, if traders are reluctant to buy 1.27 USD for 1 GBP, the price of GBP/USD will decrease. However, if there is a surge in demand and traders are keen on acquiring 1.27 USD for 1 GBP, the price will rise.
To summarize,
- When demand exceeds supply, prices go up.
- When supply surpasses demand, prices go down.
- When supply and demand are balanced, prices stabilize, leading to ranging markets.
By understanding these dynamics, traders can analyze “naked” market charts and make informed predictions about future price movements.
Understanding supply and demand forex “zones”
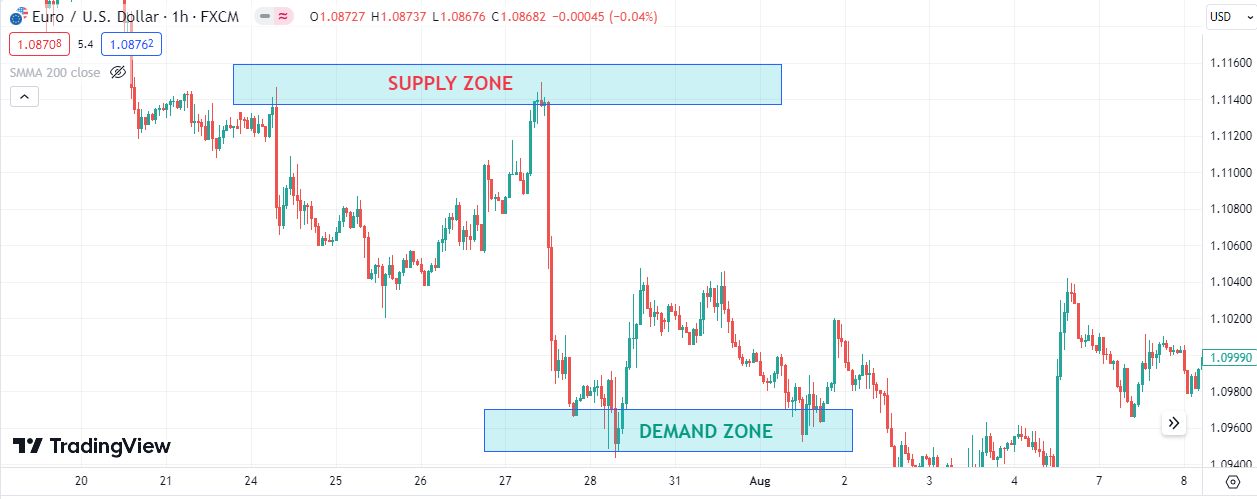
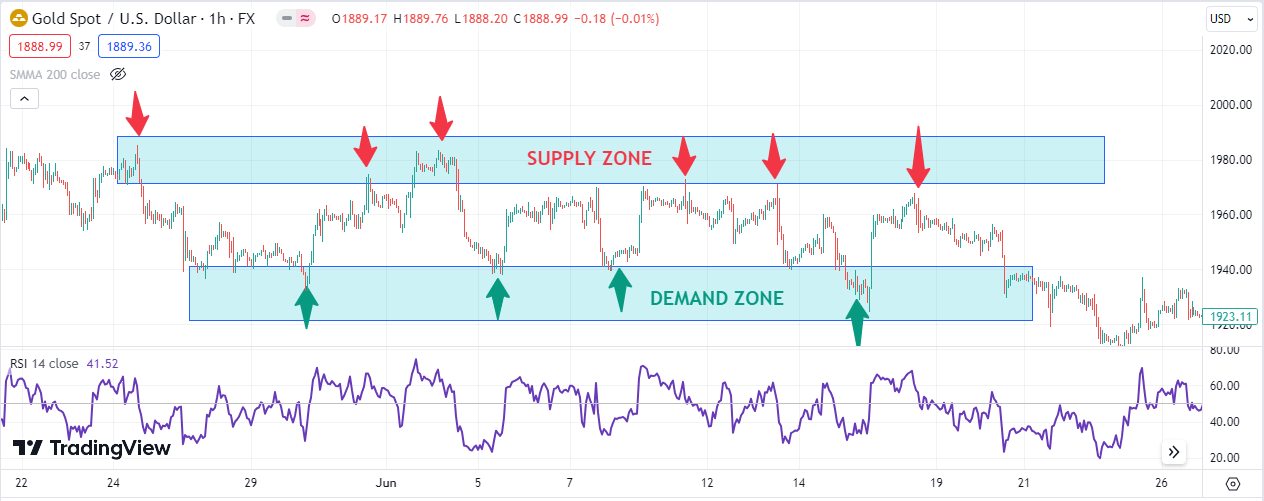
Forex supply and demand zones are regions on a price chart that indicates where the currency price has changed direction in the past due to an imbalance in buying and selling pressure.
Characteristics of these Zones
- Formation: These zones emerge when there is a sudden spike in buying or selling activity. This can be due to a variety of factors, such as economic news, geopolitical events, or central bank interventions.
- Appearance: Unlike sharp, defined lines on a chart, these zones are broader areas, reflecting that price reversals can occur within a range rather than at an exact price.
When the price approaches these zones in the future, traders anticipate numerous potential reactions:
- Reversal: Prices might reverse direction, bouncing off the zone. For instance, if a price previously shot up after hitting a certain level (a demand zone), traders might expect the price to go up again if it reaches that zone in the future.
- Continuation: If there is significant momentum, prices might break through the zone and continue in the same direction.
How to identify the support and demand zones on forex charts?
Identifying supply and demand zones on a forex chart can be a pivotal step toward understanding potential price movements. At its core, identifying these zones largely mirrors the technique used to pinpoint support and resistance levels, but with subtle differences.
First of all, look for areas on the chart where the price has been consolidating or ranging for an extended period. These zones often indicate a balance between supply and demand. These consolidation areas are essentially ‘battle zones’ between buyers and sellers.
To identify a demand zone, search for a large candle or a series of candles moving upwards away from a consolidating price zone. The region underneath the point where the large bullish candle breaks through the bodies of the prior two candles is designated as a demand zone. Such a zone signals an area where forex traders would potentially initiate buy positions or close out short positions, recognizing it as a crucial level unlikely to be breached easily.
The methodology for pinpointing supply zones is essentially the mirror image of identifying demand zones. Keep an eye out for a significant bearish candle or a sequence of candles descending past the bodies of the preceding two candles. The zone above this descending candle sequence is labeled as a supply zone. A supply zone symbolizes an area where traders anticipate resistance, making it harder for the price to break through.
Moreover, various tools and techniques can help sharpen the accuracy of identifying these zones. For instance, the Fibonacci retracement tool can indicate potential support and resistance levels, offering insights into potential supply and demand areas. Other indicators such as Moving Averages, Bollinger Bands, and RSI can also offer clues on potential reversal points and the strength of price movements.
It is also recommended to use larger timeframes to better specify these zones.
Top supply and demand forex trading strategies
Using supply and demand zones is a time-tested approach to trade in the forex market. These zones offer insights into potential price reversals, consolidations, and breakouts. Here are three high-potential supply and demand forex strategies that can offer various trading opportunities.
1. Range trading technique
Range trading is a technique in which traders look to capitalize on price movements within a defined horizontal range, buying at the lower end (demand zone) and selling at the upper end (supply zone).
How to Apply:
- First, identify well-defined supply and demand zones where the price has oscillated multiple times.
- Add technical indicators like stochastic or RSI. These can assist in pinpointing overbought (likely to decline) conditions when the price is near the supply zone and oversold (likely to rise) conditions when the price is near the demand zone.
- Aim to buy when the indicator signals oversold conditions near a demand zone and sell when it signals overbought conditions near a supply zone.
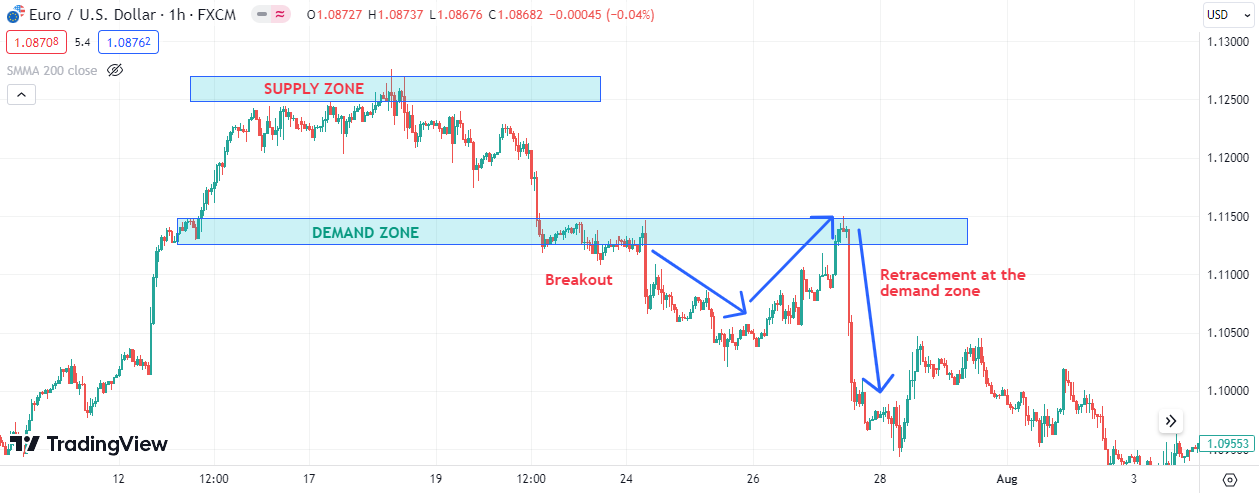
2. Breakout strategy
The core idea behind the breakout strategy is that prices cannot remain confined within a range indefinitely. Eventually, the price will breach either the demand or supply zone, signaling a potential new trend.
How to Apply:
- Monitor established supply and demand zones closely.
- Wait for price action to breach either zone with a significant candle or candle pattern.
- Enter trades in the direction of the breakout, expecting the momentum to carry the price further in that direction. Confirm the breakout by spotting a “retest” to ensure it is not a false breakout.
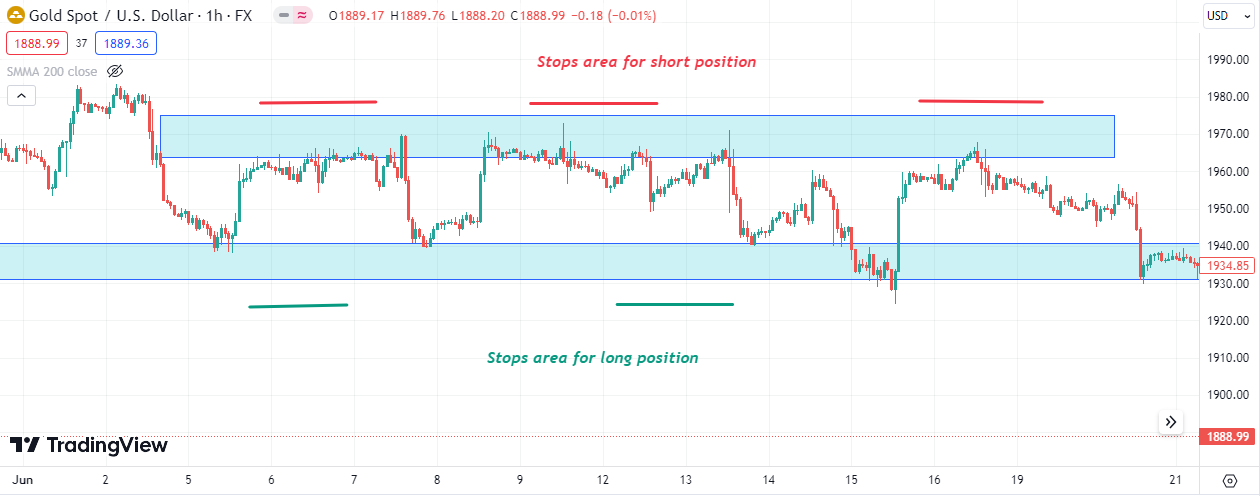
3. Supply and demand forex zone as risk management parameters
Much like support and resistance levels, supply and demand zones can serve as critical benchmarks for setting stop-loss and take-profit levels, ensuring a structured risk-to-reward ratio.
How to Apply:
- For range traders selling at the supply zone: Place a stop-loss order slightly above the supply zone to mitigate potential losses if prices unexpectedly surge. Set a take-profit order near the demand zone.
- For those buying at the demand zone: The stop-loss can be set just below the demand zone, while the take-profit can be placed near the supply zone.
- Conservative traders might choose to set their take-profit orders slightly above the demand zone or below the supply zone to ensure a higher probability of the order being executed. Alternatively, they can use trailing stops or scale out of positions to maximize potential gains while managing risk.
Bottom line
Supply and demand forex zones serve as invaluable tools for forex traders. By identifying these areas, traders can make more informed decisions about entry and exit points, set stop losses, and predict potential price movements. Always remember, however, that no single method is foolproof, and it is essential to use multiple tools in conjunction with a broader trading strategy.
Read more:
http://thetradingbay.com/2022/12/05/10-most-powerful-reversal-candlestick-patterns/