


Financial statements are vital financial documents that stipulate a company’s business dealings and financial performance. These statements shed a light on the corporation’s financial standing, displaying the status of its operations and potential for growth.
That said, investors specifically need to understand how to read financial statement in order to make intelligent investment decisions. There are several advantages of financial statement analysis for investors as it can allow them to accurately identify promising opportunities with minimal risks, hence achieving better outcomes. Typically, the market participants emphasize analyzing key metrics, like the company’s sales, net profit, debt, cash flow, and margin, from the information available in statements.
In this article, we will focus on how to read financial statement of corporations for taking well-informed investment steps. Although financial jargon can be quite overwhelming, we will try to break it down into easily understandable terms.
How to read financial statement
Typically, there are three basic types of financial statements. Here, we have explained how to evaluate them in order to assess a business’s financial well-being.
1. Balance Sheet
A balance sheet is a financial document that simply demonstrates the “worth” or “book value” of a company. It does so by summarizing the company’s assets, liabilities, and owner’s equity till the reporting date.
Components of Balance Sheet
Let’s have a closer look at the 3 parts of the balance sheet and what they signify:
- Assets point toward the total worth of a company’s possessions, whether tangible or intangible. They represent anything that a company holds and has a measurable value. Some of them are categorized as “current assets” whereas others as “non-current assets” based on their level of liquidity.
- Liabilities are the exact opposite of assets because they indicate what the company owes. They refer to the financial and legal commitments that require the company to repay money to a debtor. They can also be categorized into “current liabilities” and “non-current liabilities.”
- Owner’s equity, which is also known as stockholder’s equity, typically indicates anything that is left for the business owners and investors after all debts and other liabilities have been paid off. Simply put, if a business sells off all its assets and pays all of the remaining debts, owners’ equity is the figure that would be left behind.
This is what a typical 2-year consolidated balance sheet looks like (though the template may differ from company to company):
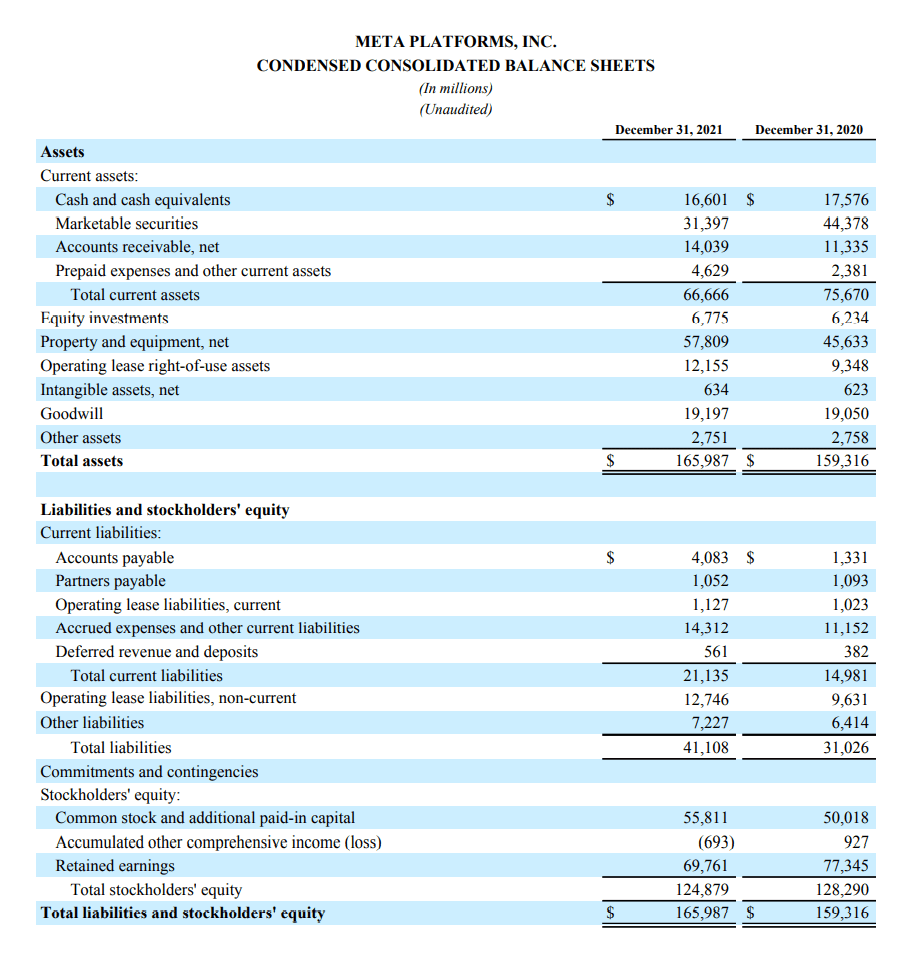
The balance sheet’s information is assessed on the basis of this equation:
Assets = Liabilities + Owner’s equity
Whereby, assets must always be equal to liabilities and owner’s equity combined under all circumstances.
How to make sense of the Balance Sheet
You can decipher the balance sheet figures with the help of three financial ratios.
1. Current ratio:
It signifies how swiftly and easily a company’s assets can be liquidated to fulfill any liabilities.
Current ratio = Current Assets/ Current Liabilities
A company should at least maintain a current ratio of 2:1, as a ratio lower than this implies insufficient available assets to meet the short-term liabilities.
2. Debt to equity ratio:
It is a metric that compares a business’s total debt to its total equity. Simply put, it points toward the extent to which a company is leveraging debt to fund its operations.
Debt to Equity Ratio = Total Liabilities / Total Owner’s Equity
Generally, a DE ratio of 1 or below 1 is deemed good whereas a ratio of 2 or higher is considered alarming. Nonetheless, it is not a universal rule and some industries tend to furnish higher debt-to-equity ratios.
3. Quick ratio:
Sometimes called the acid test ratio, the quick ratio measures a company’s capacity to pay off its short-term financial obligations with its most liquid assets. Essentially, this metric evaluates how quickly a company can convert its current assets into cash to cover its current liabilities.
Quick ratio = Quick Assets/ Current Liabilities
Whereby, Quick Assets are typically Cash equivalents, Marketable securities, and Net accounts receivable.
Note that a quick ratio of 1:1 or higher generally signifies that a company possesses adequate highly liquid assets to pay off its near-term debts.
2. Income Statement
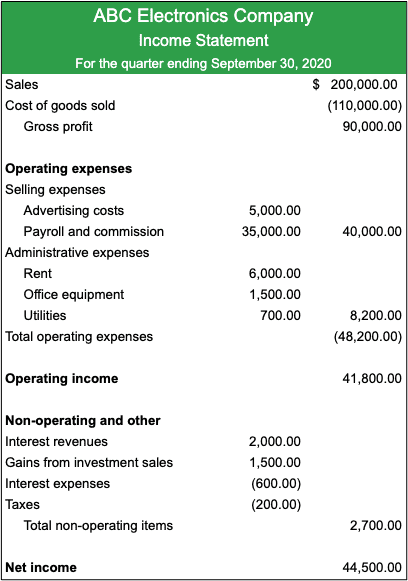
Popular as a Profit/Loss statement, an income statement is one of the most crucial financial documents that stipulate the money a business has spent and earned during a particular time span. By detailing all the income and expenses incurred, the statement ultimately indicates the net profit – which is the bottom line.
Combined with other financial statistics, an income statement enables company leaders and investors to gain a comprehensive understanding of a business’s financial health and operational results. By absorbing this information, they can assess the company’s actual worth, level of efficiency, and future capabilities.
Components of Income Statement
An income statement includes an array of metrics that define the overall situation of a company’s income and expenses over a specific period. Following are the most common parts of an income statement; however, some companies sub-divide them into further factors:
- Sales revenue
- Costs of goods sold (COGS
- Gross profit
- Expenses
- Operating income: Gross profit minus operating expenses
- Income tax expense
- Net income
- Earnings per share
- EBITDA (Operating earnings)
How to read the Income Statement
You can comprehend an income statement in the form of the following financial ratios:
1. Gross profit margin
The gross profit margin stipulates how much profit a company has made after taking into account its regular expenses, like wages, raw materials, and other direct costs.
Gross Profit Margin = (Net Sales– COGS) / Net Sales
Generally, for businesses like retailers, a gross profit margin ratio of 50 to 70% is considered desirable and indicative of a healthy bottom line. However, what is considered a “good” GPM differs substantially with each industry. For instance, businesses in the tech or finance sectors typically report much higher gross profit margins, usually ranging between 80% to 90%. Any gross profit margin ratio lower than this range is considered disastrous for such companies.
2. Operating profit margin
Operating margin details a company’s profitability by taking into account its operating expenses, such as overhead costs, in relation to revenue. This stands in contrast to the gross profit margin, which only factors in direct costs. Note that businesses have to focus on elevating this particular margin to boost their profits.
Operating Profit Margin = Operating Earnings (EBITDA) / Sales Revenue
The acceptable level of operating margin varies depending on the industry. But, as a rough guide, a net profit margin of 15% or higher is viewed as strong or favorable, a 10% margin is considered average, while a 5% margin is deemed weak.
3. Net profit margin
The net profit margin of a company manifests the proportion of its net income or profit earned in relation to revenue. The metric provides valuable insights to investors regarding a company’s management prowess in generating adequate profit from its sales while keeping a check on operating and secondary costs.
Net Profit Margin = Net Income / Sales Revenue
Note that there is no universal figure defining a “good” net profit margin as it can substantially differ across industries. However, a 10% net profit margin is typically deemed average while a 5% margin is considered low.
3. Cash Flow Statement
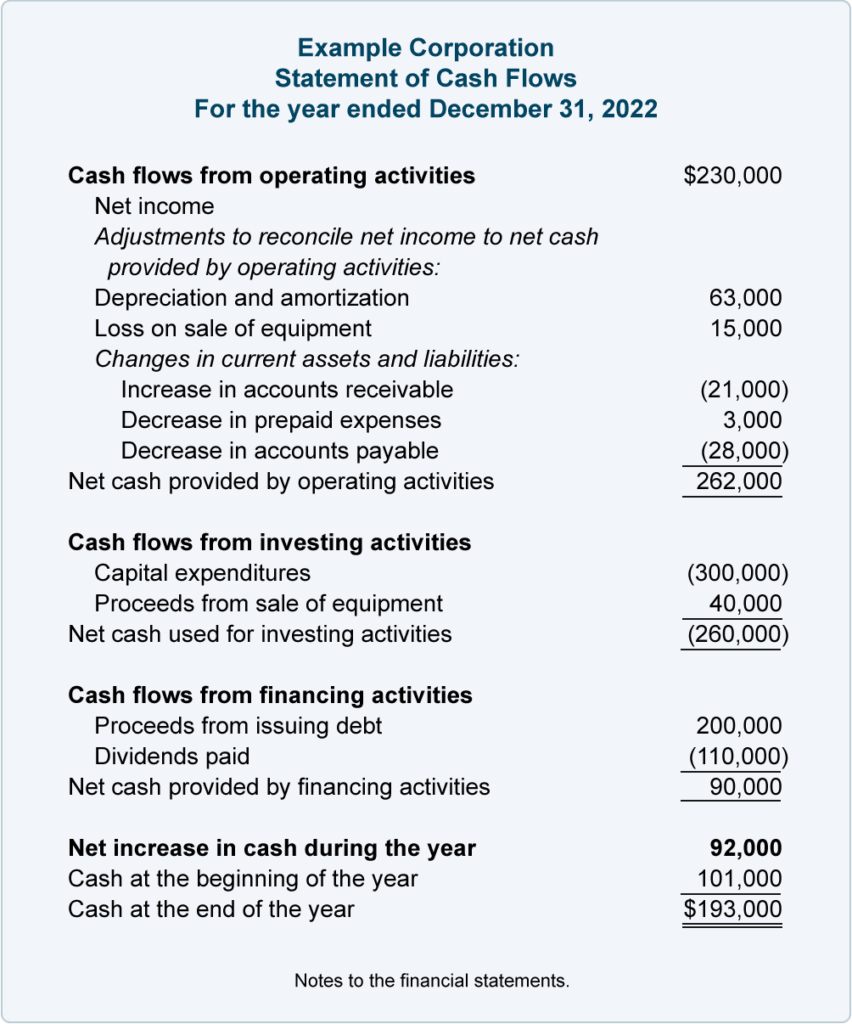
The cash flow statement captures the rhythm of a company’s operational melody – revealing the ebbs and flows of monetary inflows and outflows, and the sources and destinations of such cash movements. This statement offers a granular account of how cash was acquired and utilized during a specific period, typically known as the accounting period.
By highlighting the volume and velocity of cash traversing through a company’s books, the cash flow statement elucidates the firm’s capacity to sustain operations over both the immediate and long-term horizons.
To put it another way, cash flow statements serve as a powerful tool to gauge a company’s stage of growth, indicating whether it is an emerging startup or an established enterprise. These statements can also shed light on whether a company is undergoing a transition or experiencing a decline.
A “positive” cash flow indicates that a business is receiving more money than it is exhausting within a specified timeframe while a “negative” cash flow suggests that more cash is being spent compared to incoming payments. However, a negative flow doesn’t necessarily mean that the profits are lost.
Components of a cash flow statement
Broadly speaking, a cash flow statement can be divided into three parts:
- Operating activities enlist the cash flow generated when a company delivers its typical goods or services. This cash flow signifies both the revenue and expenses incurred during the regular course of business operations.
- Investing activities detail the cash flow generated when a company invests in assets such as physical properties like real estate, as well as non-physical properties like patents. This cash flow is generated using free cash rather than debt.
- Financing activities detail cash flow from both debt and equity financing.
How to read financial statement: Cash flow statement
Like other financial statements, a cash flow statement can also be comprehended via three types of ratios:
1. Current liability coverage ratio
The current liability coverage ratio indicates the amount of available cash flow for a particular time frame compared to the amount of debt that must be paid off in the near future, usually within one year.
Current Average Liability Ratio = Net Cash from Operating Activities / Average Current Liabilities
A current liability coverage ratio below 1:1 signifies that the company is not generating sufficient cash to fulfill its immediate financial obligations.
2. Cash flow coverage ratio
The cash flow coverage ratio measures a company’s ability to meet its financial obligations using the funds it generates from standard business operations. Note that this ratio furnishes all types of debt, including both long-term & short-term, and signifies how well a company’s operating cash flow can cover its total debt.
Cash Flow Coverage Ratio = Net Cash Flow from Operations / Total Debt
Generally, a cash flow coverage ratio of at least 1.5 or above is recommended for most businesses.
3. Cash flow margin ratio
The cash flow margin serves as a valuable indicator of a company’s ability to transform its sales revenue into cash. This metric carries significant importance since cash serves as the lifeblood of a business, with expenses and asset purchases being financed primarily through it.
Cash Flow Margin = Cash flow from Operating Activities / Net Sales
Generally, a desirable cash flow margin is 50% or higher. On the other hand, if this margin dips below this level, it suggests that a company might be facing difficulties in converting sales to cash due to excessive expenses.
Understanding how to read financial statement is CRUCIAL for better investing!
Gaining a firm grasp of a company’s financial health through its released statements can work wonders in aiding your investment decisions.
Of course, uncertainties and unknown risks will always loom, and the future appreciation of investment is never a guarantee. However, knowing how to read financial statement of companies can undoubtedly elevate your confidence and financial acumen, granting you a valuable edge in the investing game.
Also read:
https://thetradingbay.com/key-factors-that-affect-the-stock-market-performance/


