


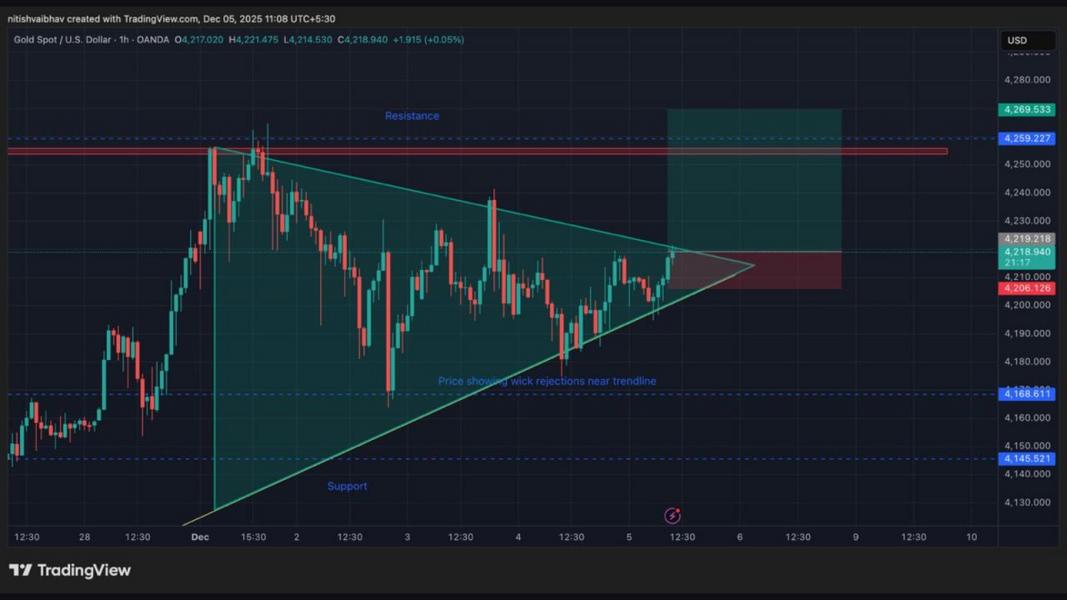
The Gold Spot versus the U.S. Dollar is currently trading at 4,218.940. This level shows the market’s indecision, situated within a symmetrical triangle pattern. The price action is flirting with key markers while momentum remains neutral. Traders are closely watching for a potential breakout that could indicate the next directional move. No significant fresh news has emerged in the past 24 to 48 hours to alter the market’s technical foundation.
On the technical side, the one-hour timeframe highlights a ranging trend that showcases price consolidation. This coiling action forms as market participants await a decisive move. The symmetrical triangle pattern signifies a notable period of volatility compression. Traders are eyeing the major resistance level at 4,259.227 as a potential target should the price break out upwards. On the downside, critical support levels are identified at 4,168.811 and 4,145.521, underscoring where downward movement might be supported.
The key zones within this market are shaping up to influence breakout potential. The area between 4,220 and 4,259 is particularly important, functioning as both a liquidity zone and a targetarea for bullish moves. This zone’s importance is amplified by rejections and target confirmations, making it a focal point for traders. Symmetrical triangle patterns often precede significant price changes, and a breakout beyond these limits could establish clear market direction.
Momentum indicators remain neutral, implying the market is in a wait-and-watch mode. However, higher lows within the triangle suggest buying interest is brewing. A failure to capitalize above the upper trendline continues to suppress advances. The price must hold above 4,206.126 to preserve a bullish stance, as slipping below this mark would negate the setup. In such a scenario, traders would likely reevaluate their positions, awaiting a clearer directional cue.
Fundamentally, the lack of substantial recent news means technicals and chart patterns are in the spotlight. Market participants are keenly watching for any developments that could catalyze major moves. Previous patterns suggest that failure below 4,206 introduces risk, setting the stage for possible decline. Conversely, a sustained move beyond 4,220 can spark bullish confidence and energize the market. Given the current quiet on the news front, technical signals should be front and center in strategic decisions.
The combined analysis derives a neutral-to-bullish directional bias subject to certain conditions. A confirmed breakout above 4,220 could invigorate a move toward 4,259, potentially even reaching 4,269. Traders should monitor the price action around the triangle structure. Assuming price consolidates gains above 4,206 and breaks the upper triangle limit, market prospects favor bullish opportunities. Conversely, a breakdown below 4,206 could invalidate this outlook, introducing bearish scenarios. In the absence of fresh macro news, technical storytelling appears to be the primary driver for forthcoming market action.


