

UK Retail Sales (MoM)
Retail sales measure the change in the total value of inflation-adjusted sales at the retail level. It is the foremost indicator of consumer spending, which accounts for the majority of overall economic activity.
The last retail sales were 1.9% which was better than the forecast of 1.0%. The expectation is that retail sales will recover from the December 3.7% low. However, rising inflation and energy costs, compounded by high interest rates and taxes will weigh consumers down.
The report is due Friday, 25 March at 07:00 GMT.

Technical Analysis Daily Time frame
Moving Average:
The two moving average crossovers, 200 and 50, here shows the overall market trend of the asset. The price had a crossover with 50MA crossing the 200MA moving down, showing selling pressure in the market.
Relative Strength Index(RSI):
RSI line was up at the start of the year, with the line touching the upper zone(70), showing overbought condition. The RSI line later touched the oversold(30) zone and is now ranging in mid 50-60 zone.
Analysis using price action:
GBPUSD on the higher-timeframe shows selling pressure. The price has been in a downtrend since mid-June 2021. The 50MA crossed the 200MA moving down, forming a death cross, signalling the market could trade further down.
The price further made a series of lower highs and lows. After the death cross formation on 2nd September 2021, the price came down to and formed a new swing low. Further, the price went up and made a double top structure as it could not break the previous structure’s lower high.
The price then broke the previous low of $1.33602. However, the market did not have enough sellers and hence led to the price jump high again, forming a new lower high at $1.37464. The market then went into an accumulative phase before crashing down again, breaking the support zone of $1.33602.
The most recent support is at $1.30056, and we can see some buying pressure moving towards the first resistance($1.33602). If the market breaks the first resistance, the price could trade further up. However, if the price is not able to break the resistance, it can move down as the overall market pressure is bearish.
Technical Analysis 4hr Time-frame
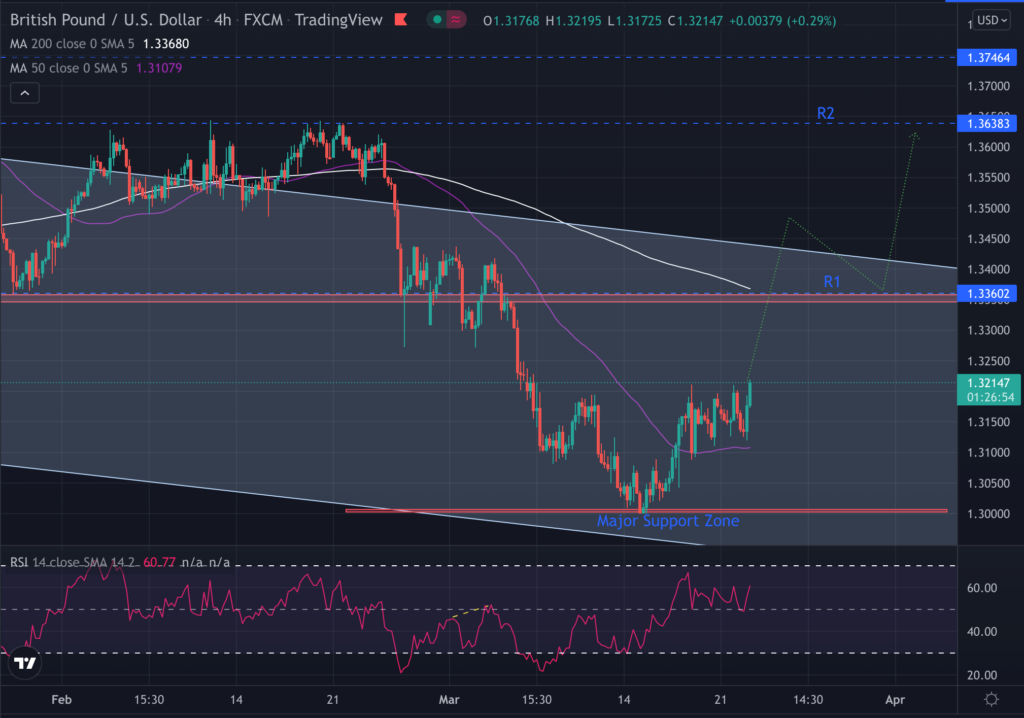
On the 4hr time frame, the 50MA crossed the 200MA, moving down, showing a death cross and bearish pressure. However, the current scenario shows the price pushing up after touching the major support zone and breaking the previous structure low. On the lower time frame, the market looks bullish and trade up.
Potential pivot points using Price Action:
| Resistance Pivot | Support Pivot | ||
| R1 | S1 | ||
| R2 | S2 | ||
| R3 | S3 |
This considerable resistance and support level can enter or exit when approaching future market openings.
Key Trading Recommendation
With the Bank of England executing back-to-back rate hikes, it means consumers will be tightening their spending. Retail sales have a significant impact on the GBP strength, therefore, high price swings are expected during this and after the news release.


