


Key Insights:
- Bitcoin’s rejection by the MA350*2 signals a critical phase in market cycles, according to the analyst.
- The approval of ETFs in January 2024 acted as a catalyst, propelling Bitcoin into a sustainable uptrend after a period of volatility.
- Pi Cycle Top Indicator’s historical accuracy builds confidence in its current signal for Bitcoin’s market shift.
Bitcoin’s stellar performance in 2024 has turned heads, with a surge exceeding 50% since the year’s commencement, briefly eclipsing its previous all-time high before a minor correction. Drawing parallels to the 2021 bull run, where BTC tripled in value within three months post-record break, analysts tread cautiously but with optimism.
The recent approval of ETFs in January 2024 marked a turning point, initiating a period of volatility followed by a sustainable uptrend. This culminated in BTC surpassing its November 2021 high, echoing historical trends observed after record-breaking rallies in 2012 and 2016.
With the impending Bitcoin halving scheduled for next month, a programmed event set to reduce the supply of new coins, analysts are referencing past halving cycles to predict potential substantial price increases. This historical context adds weight to the prevailing bullish sentiment.
Bitcoin Current Price Action
Bitcoin stands tall at $66,121 per coin, showcasing a mere gain of 0.28% in the past 24 hours. Defying historical norms, prominent BTC holders are accumulating despite nearing an all-time high. Weekly data reveals a 4.50% surge, while the 30-day performance astounds with a 50% growth, solidifying Bitcoin’s upward trajectory.
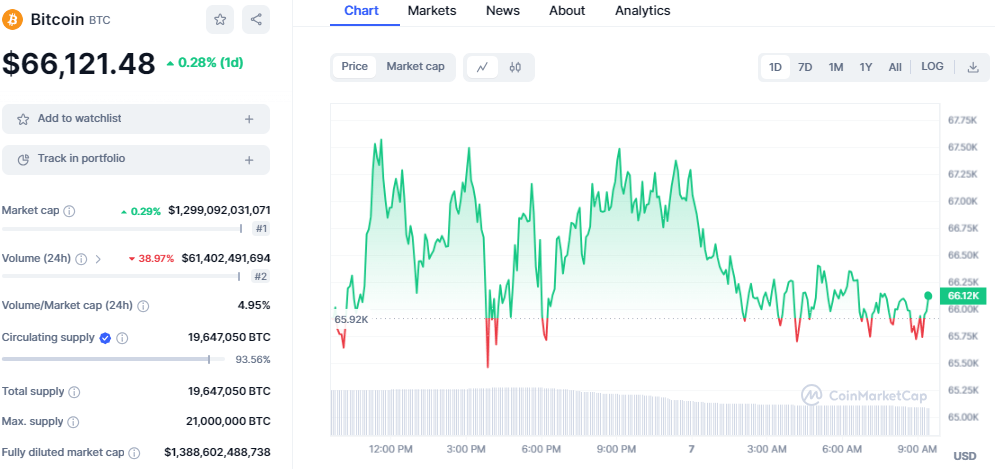
BTC/USD price chart: CoinMarket Cap
This surge catapults BTC’s market capitalization, reaching an impressive $1.29 trillion and signaling heightened investor interest. The sustained momentum hints at growing traction for the flagship cryptocurrency. Besides, this exceptional recovery emphasizes the cryptocurrency’s resilience in the face of recent market fluctuations.
What Could Have Triggered the Market Crash?
Recently, a dormant BTC whale, inactive since 2010, has reemerged, contributing to a recent market downturn by offloading over $67 million worth of BTC on Coinbase.
Bitcoin had just achieved a record high of over $69,000 on Tuesday before facing a swift reversal. Spot On Chain’s data uncovered that a substantial part of the selling pressure came from a wallet associated with BTC’s early years – the so-called “Satoshi era.”
This particular whale, dormant for more than a decade after mining 1,000 BTC when the cryptocurrency was valued at less than $0.28, has now resurfaced, capitalizing on their holdings. The timing of the whale’s move coincided with BTC’s peak, causing a subsequent crash to below $60,000 before the market began a gradual recovery.
Experts speculate that the whale has accrued a staggering $67 million in profits from this strategic sale. The significant BTC movement into Coinbase suggests a calculated move by the whale, triggering a chain reaction in the market.
Analyzing the Pi Cycle Top Indicator Signals
In a recent analysis, a seasoned crypto analyst has shed light on a crucial indicator, the Pi Cycle Top Indicator, signaling a potential turning point in BTC’s market cycle. This tool, often overlooked by some, has consistently predicted previous cycle tops with remarkable accuracy.
The trick lies in monitoring the daily timeframe, specifically the MA111 crossing over the MA350*2.
The analyst outlines a straightforward yet significant trick to discern the cycle top:
- The significant event is the genuine break of the MA111.
- It undergoes a retest to prove its validity.
- However, the real challenge arises at the MA350*2, leading to rejection.
- The critical moment unfolds as BTC breaches the MA350*2.
- The ultimate signal occurs when the MA111 successfully crosses over the MA350*2, marking the cycle top.
Recent market movements align with this pattern, as BTC faces rejection by the MA3502. The analyst asserts that the impending steps involving breaking the MA3502 and the MA111 crossing over are yet to unfold.
This suggests that, contrary to some concerns, the bull market remains robust, and the cycle top is not imminent. This analysis aligns with historical accuracy, as previous cycles have witnessed the Pi Cycle Top Indicator pinpointing cycle peaks with remarkable precision.
Bitcoin Technical Outlook
Analyzing BTC’s price chart reveals a captivating storyline. BTC demonstrated a robust upward trend, marked by a series of ascending low points and ascending high points, an encouraging indicator in the realm of market technical analysis.
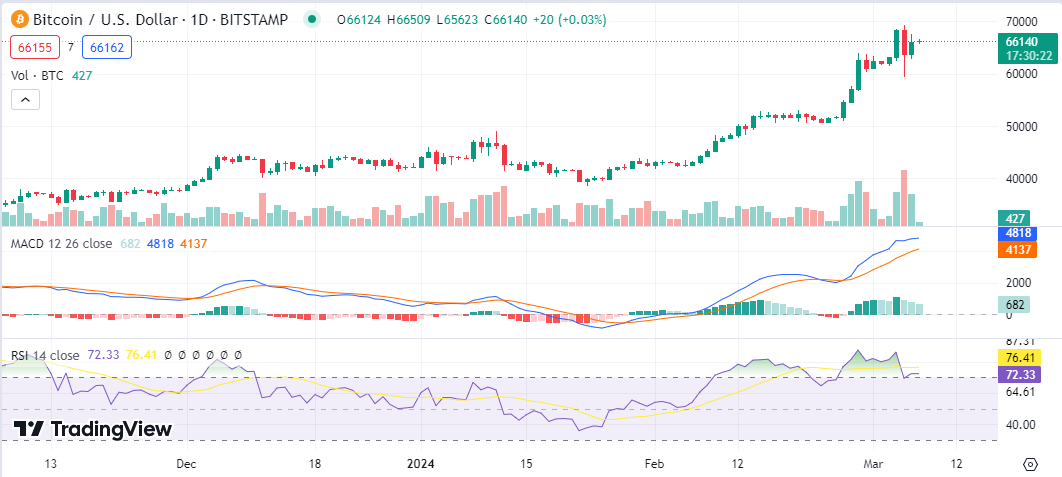
BTC/USD chart: TradingView
Moreover, the convergence of moving averages signals a continuous influx of buying activity as shorter-term averages outpace their longer-term counterparts. This particular configuration traditionally signals a prevailing bullish sentiment in the market.


