


- Bitcoin is trading above $43,000 and the 50-day exponential moving average.
- BTC could break above the $43,750 resistance if the bulls regain momentum.
- A bullish trend on the hourly chart has been formed, with key support at $42,500.
Bitcoin commenced this week with a surge in momentum, climbing from a low point near $42,000 to a peak of $43,800. Despite encountering significant resistance at this level, leading to a slight pullback, the overall uptrend continues to be evident on the hourly chart. This suggests a potential bullish reversal in the face of ongoing bearish trends.
The price of bitcoin, which last week tumbled below $39,000 as sales piled up due to the ETF outflows, has shown a decent price recovery. It’s trading at $42,980 as of press time, up about 7% from week-ago levels, as the monthly gain remains at 1%.
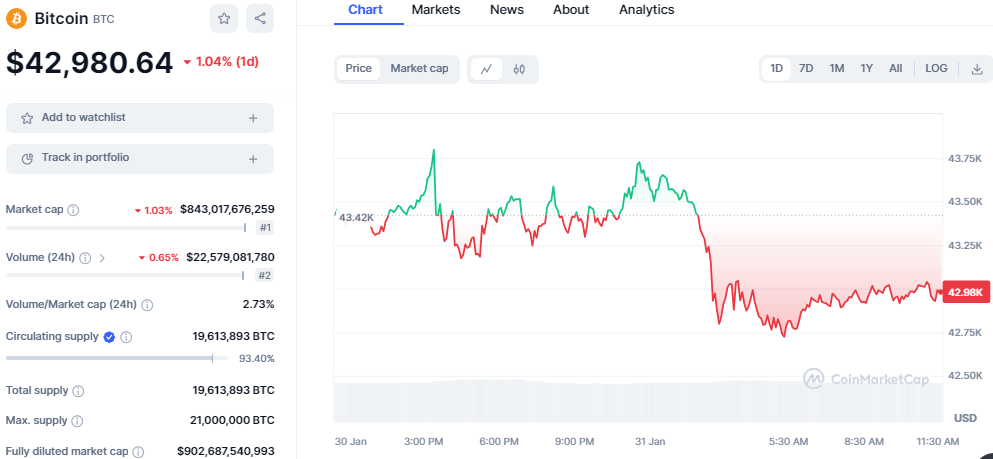
BTC/USD Price Chart, Source: CoinMarket Cap
Grayscale Bitcoin Trust ETF (GBTC) has experienced massive outflows since the launch of the spot Bitcoin ETFs, sending the price of Bitcoin downwards as a result. GBTC saw an ouflow of 470 million in the first week since the ETFs started trading after the approval. However, the amount has recently reduced, sending BTC toward the recent highs as Bitmex, a research firm, shared on X formally Twitter.
Bitcoin forms an ascending pattern on the hourly chart, with several green candlesticks forming. A minor resistance has been formed at $43,100 (20-day exponential moving average), with the bulls pushing for a break above this level. As the support at $42,500 remains strong, BTC could easily break past this level to challenge the key resistance at $43,750.
If Bitcoin makes a clear move above $43,750, it could set a path for a break above the $44,000 mark, setting another rally toward $45,000. BTC could retrace the recent highs of $48,000 if the bullish momentum restores recovering the losses. However, if the bears hold the ground tight and the $42,500 fails to hold, BTC could retrace the $40,000 level.
Technical indicators on the daily chart display a bullish outlook. The Relative Strength Index (RSI) and the Moving Average Convergence Divergence (MACD) have recovered from the downtrend and are trending upwards. This suggests a bullish reversal, which could push BTC higher.
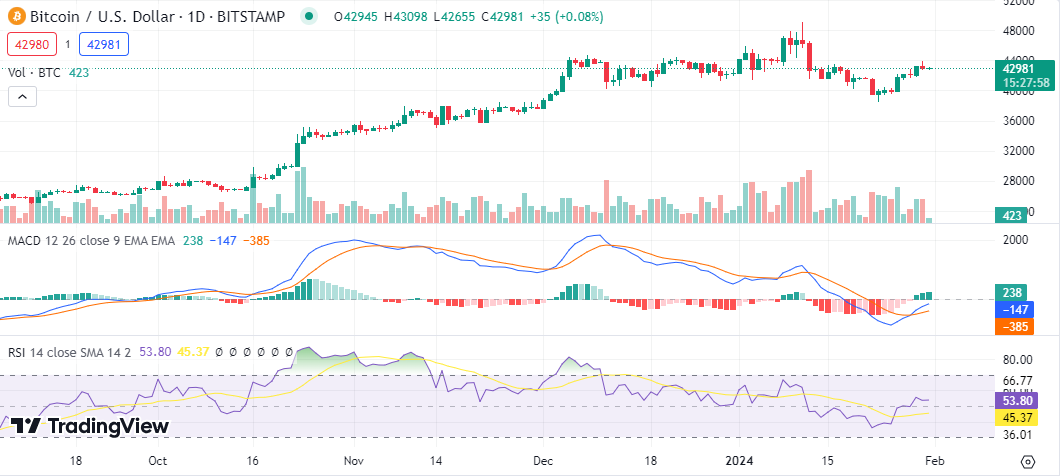
BTC/USD 1-Day Price Chart, Source: TradingView
Looking at the MACD indicator, the MACD line has climbed above the signal line while trending below the zero line. The histogram has switched from the negative region to the positive region, and the histogram has started to print green bars, suggesting an increase in buying pressure. The RSI has climbed above the 50 index at 53.80, indicating a neutral market.


