Key Insights:
- Bitcoin surpasses $46,000, showing a 3.95% increase, with market cap reaching $909 billion.
- Withdrawals of 25,305 BTC from exchanges mark a shift to long-term holding strategies.
- Technical indicators like RSI and MACD signal strong bullish momentum for Bitcoin.
The leading cryptocurrency in market capitalization has surpassed the $46,000 threshold for the first time since the day following the commencement of spot ETF trading and on the monthly chart. Currently, BTC has experienced a 3.95% increase in value over the last 24 hours, standing at $46,359.

BTC/USD price chart: CoinMarket Cap
After consolidation, BTC broke out on the upper side as bulls engulfed the abroad crypto market. The market cap and daily trading volume rise have accompanied the bullish momentum. The market cap has climbed to $909 billion while the daily trading volume peaked at $28 billion, an increase of 4% and 16%, respectively.
BTC is ready to challenge the key and earlier resistance at the $48k level which formed in earlier January after the ETF approval rumours. BTC has been climbing below this level, with the resistance level forming at $44k and $46k. BTC could be gearing up to retrace the $48k and $50k levels in the coming sessions if the current trend holds.
Positive Market Trends Support Analyst’s Forecast
According to data from Glassnode, the significant uptick in BTC’s value can be attributed to a noteworthy reduction in Bitcoin holdings on exchanges, with 25,305 BTC (equivalent to $1.1 billion) being withdrawn in the last two weeks. This activity has led to the smallest proportion of BTC on exchanges, indicating a trend among traders toward adopting long-term investment strategies.
Cryptocurrency analyst Ali Martinez provided insights on X regarding Bitcoin’s price movements, highlighting key support and resistance levels. Martinez notes a critical support level for Bitcoin at $42,560, a price point at which 1.02 million BTC were traded.
The stability of Bitcoin’s price could depend on its ability to maintain this level. On the other hand, resistance levels at $47,360 and $56,970 may pose challenges to Bitcoin’s upward momentum.
Additionally, the Super Trend indicator has recently signaled a buy on Bitcoin’s monthly chart. This tool, recognized for accurately forecasting Bitcoin bull markets, has issued four buy signals since Bitcoin’s inception. Each signal has historically led to substantial gains, with increases of 169,172%, 9,900%, 3,680%, and 828%.
Bitcoin Technical Indicators Outlook
Looking at the technical front, Bitcoin is strongly bullish, with major indicators signaling a clear uptrend. Indicators such as the Relative Strength Index (RSI) and Moving Average Convergence Divergence (MACD) have steadily climbed from neutral positions as they head up toward the overbought regions.
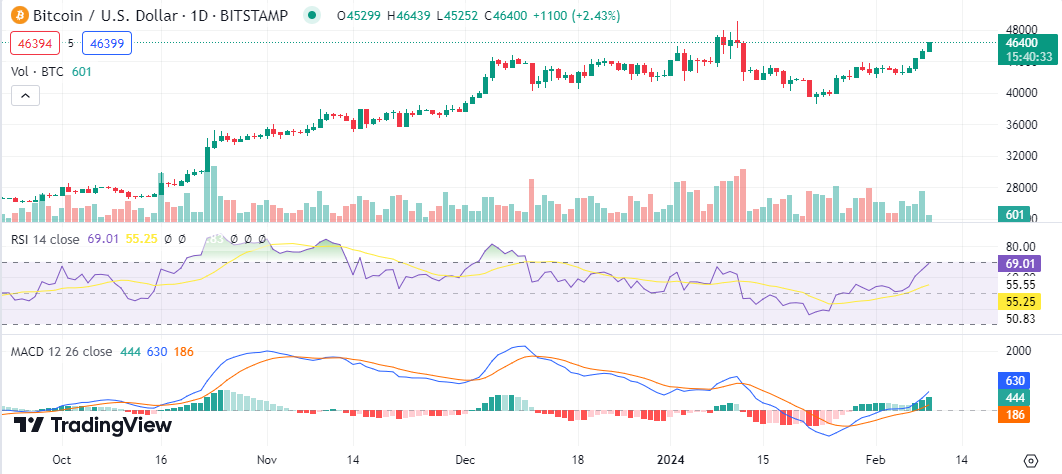
BTC/USD price chart: TradingView
On the daily chart, the Relative Strength Index climbed to the overbought region, with the current level set at 69, suggesting increased buying pressure. Moreover, the MACD indicator is rallying high, with the MACD line climbing further above the signal line. The MACD value has turned positive with a value of 630 as the histogram prints green bars with a strong bullish momentum.