


Being the first cryptocurrency ever created, Bitcoin (BTC) has remained the undisputed leader of the crypto space throughout the years. Although this digital gold was not immediately noticed by the general public, its sharp price hikes soon gained the attention of financial enthusiasts. Over the past few years, Bitcoin has managed to retain its dominance with the highest market capitalization and daily trading volumes despite facing tough competition from the growing power of altcoins, NFT, and other metaverse tokens.
That said, the blockchain-based digital currency has multiplied exponentially in just a little more than a decade; however, the journey was not without its ups and downs. Currently, the prolonged Bitcoin crash has spooked crypto investors as it has lost more than 70% in value over the last twelve months.
Here is a brief timeline of the monumental surges and crashes of Bitcoin since its debut in 2009.
Before starting, we want to emphasize that as per the historical data, Bitcoin’s price has repeatedly moved in “cycles”, dramatically surging, then immediately crashing & repeat. Moreover, it has always manifested “aggressive volatility” where drastic changes sometimes occurred in a span of just one to two days or weeks.
Bitcoin (BTC) was created in 2009 but showed its initial major spikes in 2011 & 2013
Bitcoin was officially launched in January 2009 by an anonymous person using the pseudonym “Satoshi Nakamoto.” The coin made an appearance during tough financial times when the global economy was strained and people were becoming disillusioned with the central banks and governments.
The first Bitcoin transaction was recorded in late 2009 when the participants on BitcoinTalk forum traded 5,050 bitcoins for $5.02 via PayPal. However, the first-real world exchange occurred in 2010 when a Bitcoin owner paid 10,000 BTC for two Papa John’s pizzas priced at about $25 – an exciting tale that has continued to pass on among Bitcoin enthusiasts.
Coming back to the pricing, note that Bitcoin’s proper pricing data is available from only mid-2010 onwards as there were no proper exchanges at that time. The digital currency’s price kept rolling below the $0.40 level in 2010; however, it surged tremendously in 2011, hitting $30 by mid-year. After that, Bitcoin kept swirling down till the end of 2011 and finished the year at just around $4, falling more than 90% from its all-time high.
Only after a consolidated and dull 2012, Bitcoin began to pick up the heat again in 2013. It spiked to $230 by April 2013 after a remarkable and swift upward rally, then again crashed down to $68, and eventually closed the year at a monumental $850.
Naturally, 2013 is hence marked as the most volatile year of Bitcoin where it violently swung to both sides and crossed the $1000 zone for the first time.
Bitcoin (BTC) displayed muted volatility from 2014-2016 and see-sawed below the $1000 level
2014 was another volatile and eventful year for Bitcoin when it dwindled to the $111 level in February amid the Mt. Gox drama. Mt. Gox was an early-period crypto exchange that filed for bankruptcy after losing over 744,000 Bitcoin from user funds, causing this massive Bitcoin crash. Although the coin again reached the $590 level soon after, it spent the remaining year without much activity.
2015 also did not witness much action where Bitcoin exited the year at $430. Price began to gain traction by mid-2016 and climbed near the $1000 level by the year-end.
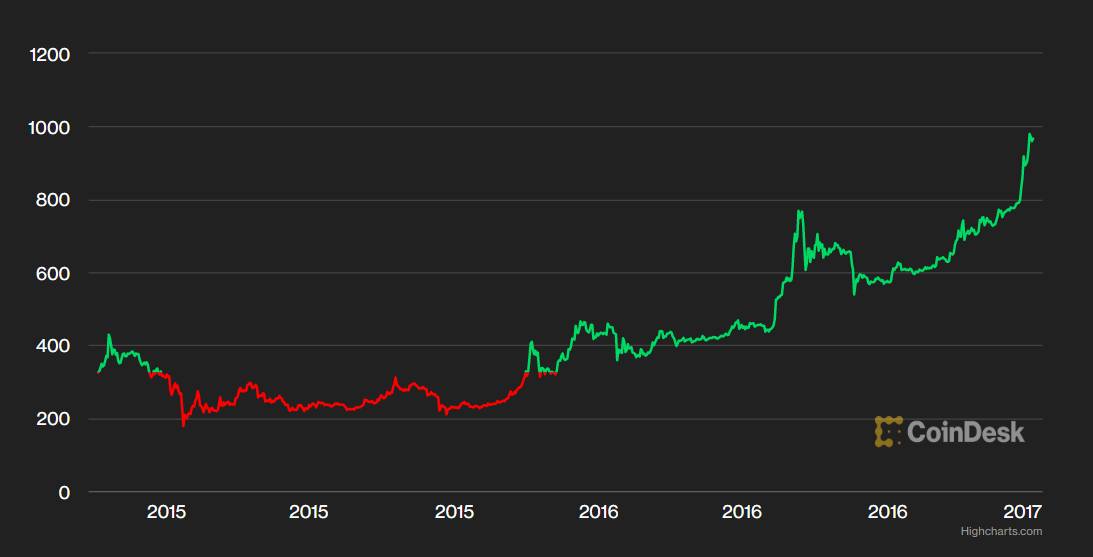
Bitcoin (BTC) exploded in 2017 but shed nearly 70% of that gain in 2018
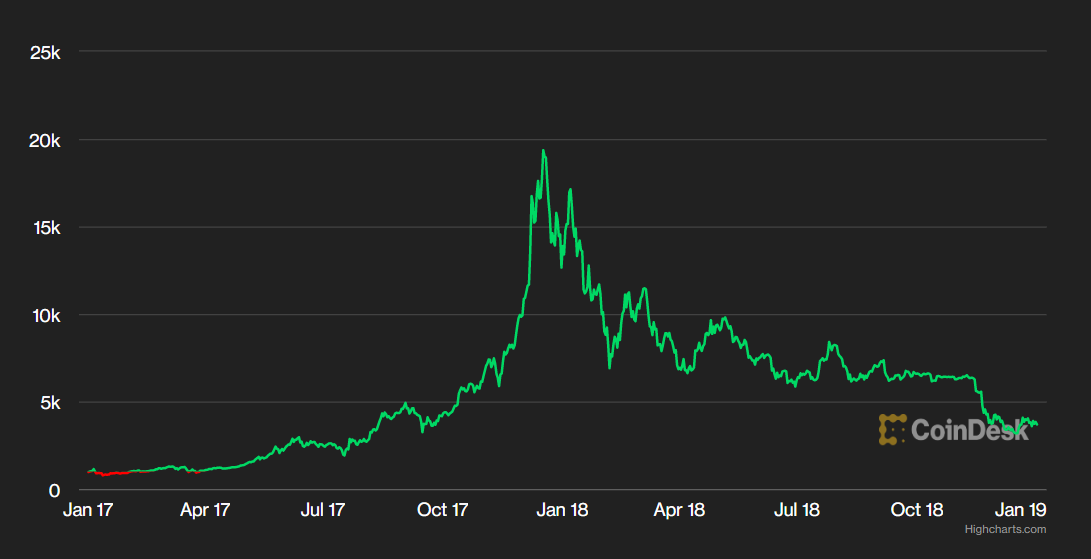
While Bitcoin entered 2017 meekly, it was a historic year when its price ascended above $19,000 by mid-December. It was priced at $2000 in July but ended the year at nearly $13,000, gaining a remarkable 1338% over the course of the year
This enormous activity did not go unnoticed as more and more retail traders jumped in to buy Bitcoin, generating great hype around this digital asset.
Having said that, anyone associated with the crypto space must have heard about the disastrous 2018 Bitcoin crash or crypto winter. By the end of April 2018, Bitcoin lost nearly 50 percent value compared to where it had started the year. Dismally, it departed from 2018 at $3,709 – showing a decline rate of 73% for the year.
2019 was a lukewarm year for Bitcoin (BTC) but it picked up pace in 2020
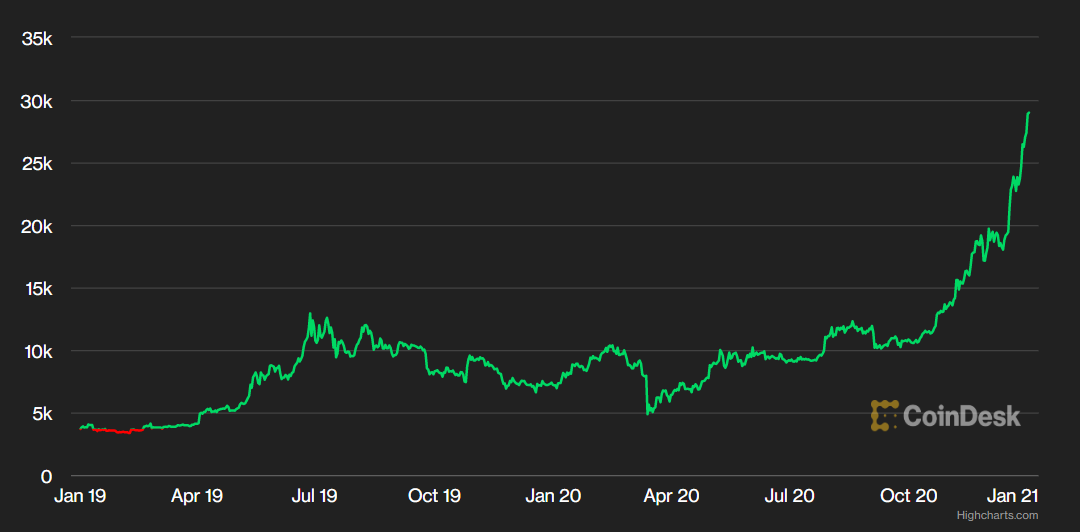
Bitcoin also struggled during the initial span of 2019 but finally began surging after April, when it hit the $5,000 point. Although the coin crossed the $13,000 mark at one point in 2019, it couldn’t sustain the gains and finished the year at under $7,200.
During the initial pandemic wave in 2020 (March 2020), it tumbled to as low as $4,800 amid the broader market drawdown. However, the decline was only temporary as the digital currency climbed to new and new heights over the next months. It created several all-time highs after crossing $20,000 in November 2020, trading at around the $29,000 zone by the end of year.
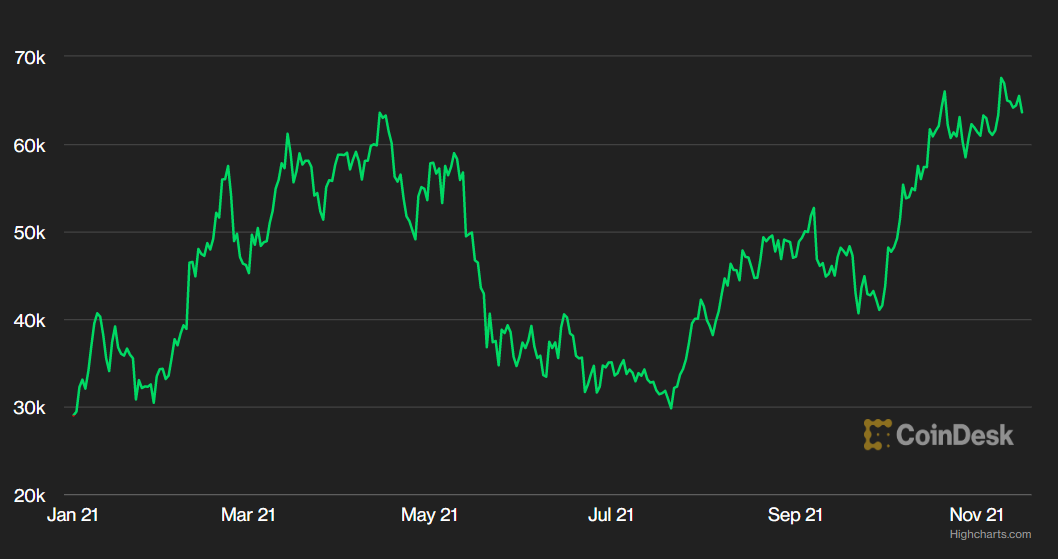
Bitcoin (BTC) jumped up to unprecedented levels in 2021 during the COVID-19 wave
The steam of the previous year did not die down as Bitcoin entered 2021. It can be termed a monumental year for digital gold where it peaked “two times.” The cryptocurrency registered a spectacular all-time high of $64,000 in mid-April, following a phase of quick gains but shed more than 50% soon after amid news of China’s crypto crackdown.
However, the digital coin again soared through all challenges and created a new all-time high, at $68,789, in November 2021.
From November 2021 to the present – Bitcoin (BTC) has fallen drastically amid tightening monetary policy and crypto bans
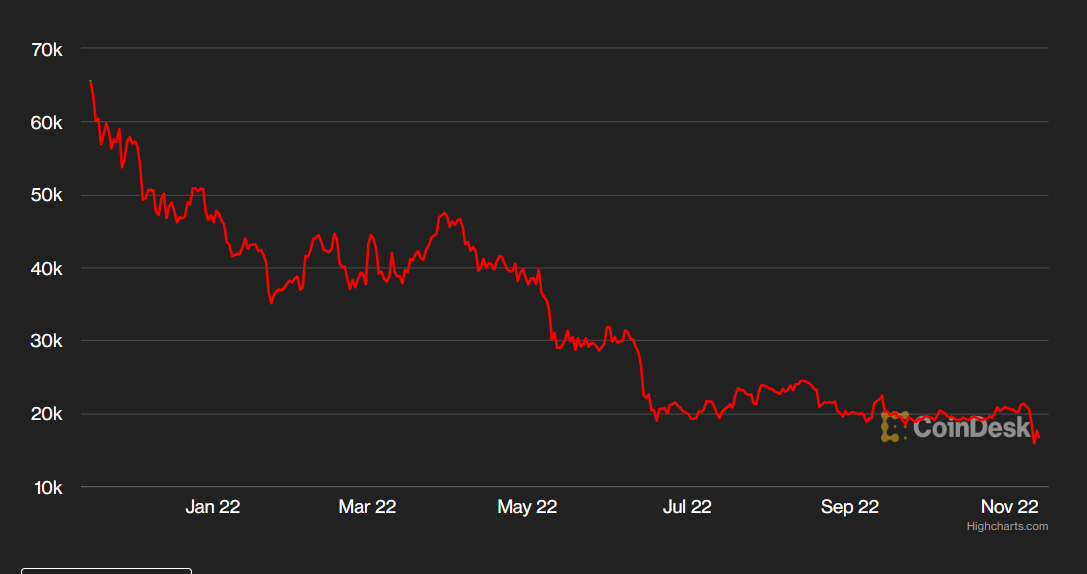
When the Federal Reserve displayed a hawkish stance in late 2021, it triggered another Bitcoin crash cycle. With decades-high inflation, geo-political tensions, and macroeconomic instability, market traders began throwing off risky assets like stocks and cryptocurrencies, Bitcoin being one of them. Its price has been sharply crashing since then, and the deplorable decline has continued during the whole course of 2022 even as we are nearing this year’s end also.
Unfortunately, 2022 might be remembered as one of the darkest years in financial history as major stocks toppled down and Bitcoin slumped to levels not seen since 2020. The “Bitcoin crash” has seen the coin shed more than 70% in value since the start of this calendar year. Despite short bullish spikes and attempts of recovery, the digital coin has failed to regain its upward momentum and is currently hovering around $17,000 levels.
Where could Bitcoin go next? Will it further decline or snatch its lost glory back? Only time will tell.


