The foreign exchange market is the largest and most liquid platform incorporating the trading activity of millions of traders, including central and commercial banks, corporations, institutional traders and retail traders. According to some estimates, the daily trading volume within the forex market surpasses the $6 trillion mark, easily making it the most widely-traded financial market in the world. This global popularity is on account of its easy accessibility, lower entry barriers, and high profitability chances. In this article, we have overviewed the working of forex trading, its basic components, and analysis methods. In this article, we would learn what is Forex trading and how does it work.
Table of Contents
ToggleWhat is Forex Trading and How Does it Work?

Forex trading is the practice of participating in the foreign exchange market by exchanging or trading currencies against each other. In everyday life, forex trading refers to the practical exchange of currencies for one another; for instance, when you trade a USD for JPY when travelling abroad, it comes under the domain of forex trading.
However, what we are discussing here is the virtual exchange of currencies on a decentralized and electronic forex market that remains open 24 hours a day from Monday to Friday night. The currency trading is conducted over-the-counter, which means there is no physical exchange of the currencies. Instead, traders strive to generate profits by speculating on the future price direction of currencies. In the simplest words, if a trader anticipates for a currency to rise in value, he would take a “buy” position accordingly.
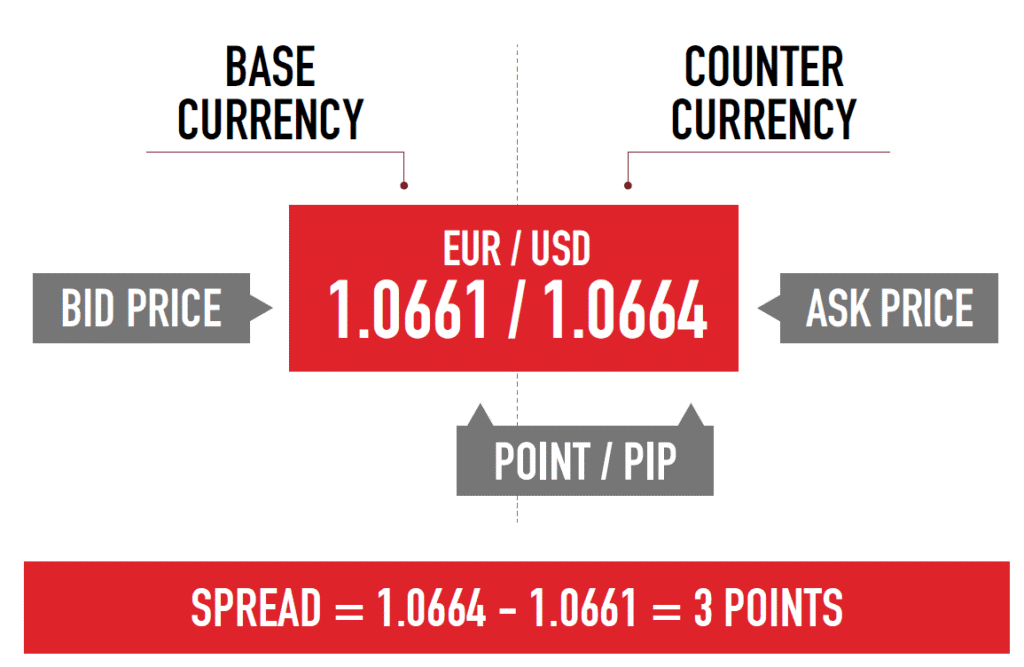
One important thing to know is that forex trading always occurs in “currency pairs”; the currencies are listed in the form of pairs like EUR/USD or GBP/JPY. The first currency is called “base currency” in these pairs, whereas the second one is known as “quote currency”. Traders predict whether the base currency would strengthen or weaken relative to the quote currency and correspondingly place the trades for acquiring returns.
To illustrate, when considering the GBP/USD pair, if a trader expects GBP to gain value relative to USD, he will go long on the pair, whereas if he speculates a decline, he will place a “sell” trade position.
Basic Terminologies of Forex Trading
Price quotes
Price quotes that are mentioned besides the currency pairs refer to the exchange rate for the two currencies. As mentioned above, the first currency in the pair is called “base”, and the second one is known as “quote or counter currency”. The price quotes stipulate the amount of quote currency required to buy one unit of the base currency. Keep note that the base currency is always considered to be 1 unit and only the value of quote currency varies relative to the base.
For clarification, consider a EUR/AUD currency pair with a price quote of 1.4902. It means that 1.4902 AUD is needed to buy 1 EUR, or 1 EUR will buy 1.4902 AUD.
Leverage
Leverage is one of the primary reasons for the massive interest in forex trading. It allows the traders to get a magnified market exposure with a limited deposit amount. With leverage, traders can open large trade positions with a relatively small capital that results in amplified returns not possible otherwise. Leverage is usually indicated in the form of ratio; for example, a 200:1 leverage means that for every $1, you can place a trade worth up to $200.

Bid-ask spread
Bid-ask spread refers to the difference between a currency pair’s ‘buy’ and ‘sell’ prices. The bid is the highest amount buyers agree to pay for a currency, whereas ask is the lowest price at which a currency can be sold. Generally, the brokers make their earnings from these spreads as trades get executed at the bid-ask value.
Lot
In forex trading, trades are placed in a standardized currency size known as lot. One standard lot equals 100,000 units of a currency, but mini and micro lot sizes are also available that consist of 10,000 and 1,000 units of a currency, respectively. The lot size directly impacts the returns; for instance, a larger lot trade delivers large profits or losses, and vice versa.
Margin
Margin and leverage are correlated concepts. Margin is the money you need to set aside as a deposit for opening a leveraged trade position.
How to Get Started with Forex Trading?
Getting started with forex trading has become extremely easy and simple with the availability of thousands of brokers and no hefty deposit requirements.
1. Select and register with a broker
Firstly, you need to select a reliable trading broker that matches your preferences. Choosing the right platform is considerably important as a wrong brokerage service can further aggravate the trading risks. Some factors you should consider when looking for a broker include their security structure, regulation, fees, spreads, allowed leverage, minimum deposit limit, and public reputation.
After selecting a broker, you have to make a trading account by providing the required personal information.
2. Make a deposit
The next step is to make a deposit in your account if you want to practically participate in the markets. You should carefully decide your deposit amount and risk only what you could afford to lose. Nowadays, many brokers allow starting with a minimal deposit amount from as low as $1.
3. Develop a trading plan
Navigating the forex waters without any solid trading strategy or plan can lead to catastrophic losses. The forex markets withhold a tough competition involving banks, institutional traders, and many other parties. To survive and generate profits from this sphere, you need to have significant analysis skills and market knowledge. Moreover, it would help if you draft some fixed trade entry/exit rules and risk-management plans. We have discussed the market analysis types in the next section.
4. Start trading
Finally, you can start trading and open trade positions on your desired currency pairs. You can access the price graphs and place trade orders through an online trading platform that your broker supports. Some popular trading platforms are MT4, MT5, and Tradingview, which offer a wide range of tools, indicators, and features for efficient trading.
Studying the Price Graphs – Technical Analysis
Technical analysis refers to studying historical price data to predict future price movement. It is an analytical strategy that is based on the idea that the market moves in repeatable, fixed patterns and all the required information is entirely incorporated in the price activity.
Let us look at the two main components of technical analysis:
Price patterns
Price moves in waves and forms some patterns that indicate its future direction.
- Head & shoulders
The head and shoulders is a formation with three peaks, the middle peak being highest than the first and third one. An upside H&S is a bearish reversal pattern that appears at the end of a bullish trend. Traders can enter a “short” position on the break below the neckline support level.
Similarly, an inverse H&S indicates a bullish reversal as it forms at the termination of the downtrend.

- Flags / pennants / wedges
Flags, pennants, and wedges are known as continuation patterns, as a trend most likely continues after their formation. Falling wedge, pennants, or flags appear after a strong bullish move when the price consolidates for a short period. The break above the upper resistance line points to the bullish trend continuation.
Conversely, raising flags, pennants, and wedges assemble after a sharp bearish price move. Traders can enter a “sell” trade position when the price breaks below the lower resistance line of these formations.

- Double and triple tops or bottoms
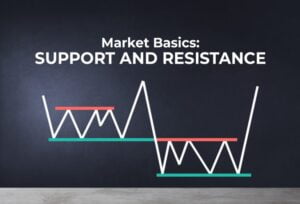
Double or triple tops is a bearish reversal pattern that forms at the conclusion of a bullish trend. It appears when the price repeatedly hits and gets rejected from the resistance zone.
On the other hand, double or triple bottoms appear when the price strikes the support level two or three times before moving in the opposite direction. It is a bullish reversal pattern that could be frequently seen at the end of bearish price flow.

- Ascending and descending triangle
The ascending triangle pattern is a formation incorporating an upper flat trend line and a rising lower trend line, converging at one point. This triangle indicates a bullish market sentiment. If it forms in the middle of an upward trend, traders expect the preceding trend’s continuation. However, if it forms during a bearish trend, traders expect a trend reversal in the bullish direction.
Contrarily, a descending triangle is a convergence of a flat lower trendline with a descending upper trendline, stipulating a bearish market sentiment. When this triangle forms in the path of a downtrend, it indicates the continuation of the ongoing bearish trend. Whereas it can also develop after a bullish trend, specifying a bearish reversal.

Technical indicators
Technical indicators are the cornerstone of technical analysis as they help the traders in making sense of the raw market data. Forex traders utilize various indicators (whether individually or in combination) to complement their trades.
- Moving averages
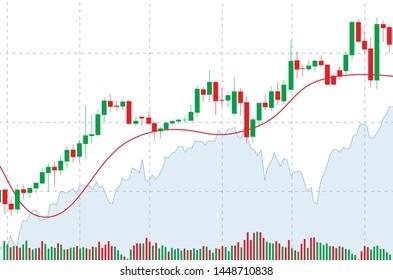
Moving average is an overlay trend indicator that appears in the form of a line on the graph. It smooths out the previous price data of a specified number of days; for instance, it can be set up according to different periods such as 50-period MA or 200-period MA. To say simply, moving average manifests the constantly updated- mean of the historical price information.
Moving averages are undoubtedly one of the most commonly applied technical indicators as they help the traders identify the market trend. They can be utilized in a variety of ways to place trades; for example, some traders employ MA crossover strategies, whereas some use them as support and resistance levels to open “buy/sell” positions. Generally, traders look for buy positions when the price moves above a moving average. Conversely, traders prefer to enter “sell” trades when the price ranges below the moving average.
- RSI
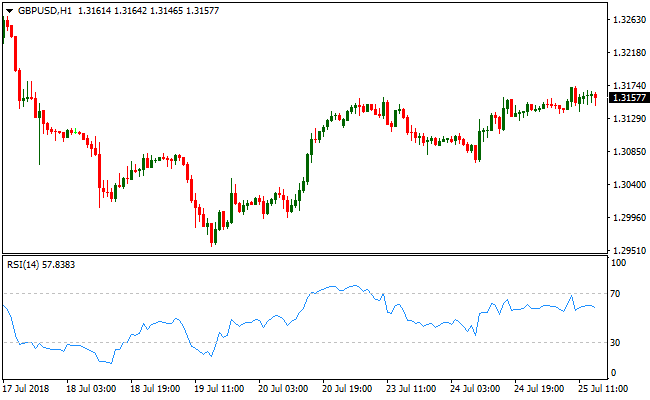
The relative strength index is a momentum indicator that calculates the price information to classify the overbought or oversold areas. It is an oscillator with values ranging from 0 to 100 where a reading above 70 indicates overbought conditions and a reading below 30 stipulates an oversold market. RSI is useful in both ranging and trending markets as it can identify good entry/exit points.
- MACD
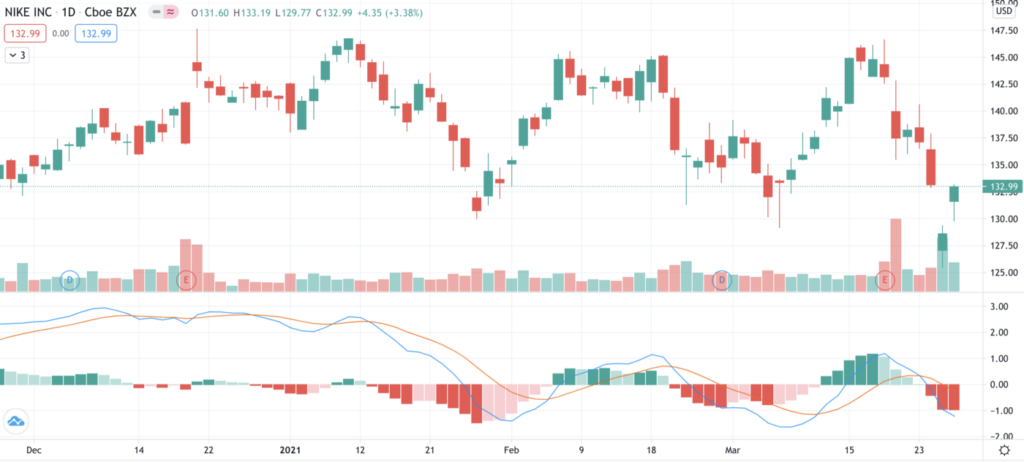
MACD (Moving average convergence and divergence) is also a momentum indicator that involves two oscillating exponential moving averages. If the MAs are above the baseline, it points towards a bullish price direction. Contrarily, if the moving averages oscillate below the zero line, a bearish price direction is expected. Moreover, the MACD crossover strategy is one of the best methods to enter trades following the trend direction.
- Fibonacci levels
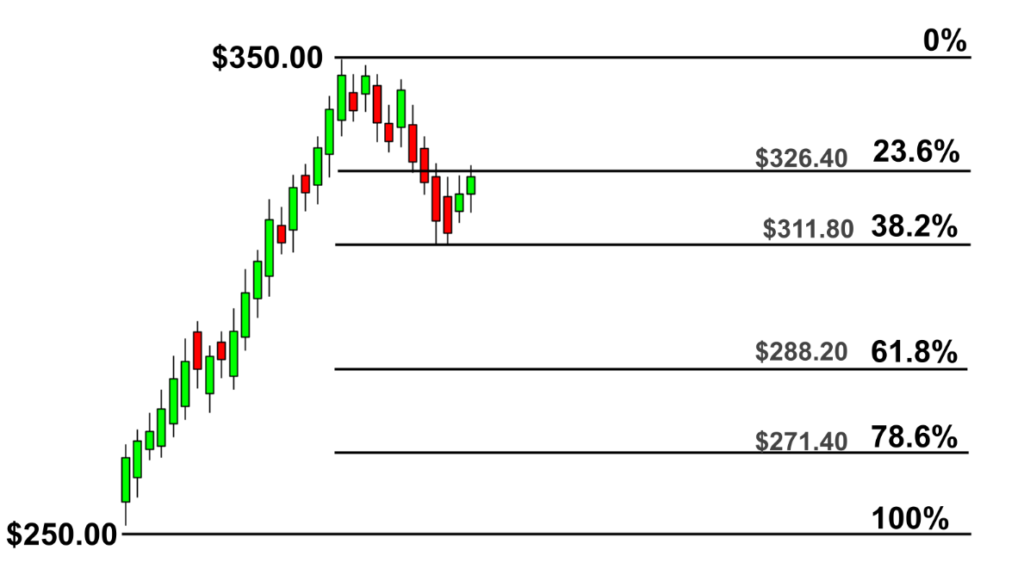
Fibonacci is a drawing tool that can be stretched between two key price levels to spot the potential retracements zones. The most important Fibonacci retracements levels include 38.2%, 50%, and 61.8%. With this indicator, traders can enter in the direction of the trend when the price pullbacks to one of the Fibonacci areas.
Examining the underlying drivers – Fundamental analysis
Fundamental analysis focuses on gauging economic, political, and social factors that can influence a currency’s value. Instead of considering the historical price movements and graphs, fundamental analysts predict the future price direction by examining the underlying drivers of a currency’s strength.
Out of all the components, economic factors carry a more significant impact on the currencies’ worth. Traders can assess a country’s financial situation from GDP data, interest rates, trade deficit or balance, debt ratio and unemployment rate. Moreover, an economic calendar records all the important events and data releases that can suddenly change the market sentiment and price trajectory.
To cite some examples,
- A better than expected Consumer Price Inflation (CPI) report could enhance public confidence in the relevant currency, positively impacting its value.
- A negative trade balance report could have a negative effect on a currency’s valuation.
- A better than expected Producer Price Index report (PPI) could positively influence a currency’s value.
You may also like:
Is forex trading suitable for you?
There is no doubt that forex trading is one of the most lucrative ways to earn money. But you should be clear about some facts before treading in this sphere. For emerging as a successful trader, you need to be consistent, patient, skilful, rule-follower, and thoroughly understand what forex trading is and how it works. You should know that forex trading involves considerable risks and does not guarantee results even if you proficiently trade via an established plan. Moreover, inculcating unbridled emotions, like fear, greed, and anger, in your trading can negatively impact your decision making power and cause huge losses.
To avoid such scenarios, you should remain level headed under all conditions, implement risk management strategies, and realize that losses are a part of trading. You need to ensure that the value of your winning trades surpasses the losing trades. In a nutshell, generating substantial gains from forex trading is possible if you own sufficient trading expertise and market knowledge; however, you must take out unrealistic expectations and excessive emotions from the picture.


