
While a large number of tools, indicators, and advanced trading algorithms or objects are now easily accessible to all market traders, price action trading is still the preferred choice of most traders. The simplistic price action patterns allow them to understand the prevailing market sentiments and offer a clear picture of all probabilities and where the price could move next.
That said, continuation trading patterns are one of the major pillars of price action trading as they frequently appear on market graphs. Let us look at what exactly are they and the top continuation patterns you should know to actively grab in-trend trading opportunities.
What is a continuation trading pattern?
A continuation trading pattern is a formation that appears within a trend and indicates the resumption of the original trend. Continuation patterns are signified by a “price consolidation” phase where the trend temporarily pauses before the price again continues on its original trajectory. Generally, they are considered to be most reliable when the ongoing trend is relatively strong while the developed continuation pattern is small than the trending price waves.
Note that some conditions must be met in order to label a continuation pattern as one. For instance, the surrounding price action context has to be according to the established rules. A continuation-type pattern in a ranging market may not indicate anything as the associated situation is not as per the required conditions.
Top continuation trading patterns
All in all, continuation trading patterns extend reliable and simple opportunities to market participants. Here are the top 5 continuation patterns that you should be aware of as a trader.
All these patterns have both bullish and bearish variants.
1. Triangles
As the name suggests, a triangular continuation pattern is identified by two converging trendlines as the price volatility slowly fades. There must be at least two swing highs and swing lows for a triangle to be completed, though the swings may range up to four or more.
Triangles exist in three basic forms, which are as follows:
- Ascending triangle:
An ascending triangle appears in the middle of a bullish trend and signals its continuation. It is formed by two converging trend lines where the rising swing lows record an ascending line and the fixed-level swing highs create a flat upper trend line. Traders wait to enter a bullish position at the subsequent price breakout.
- Descending triangle
A descending triangle is signified by a descending upper trend line and a straight lower trendline that converge at one point. It is a continuation pattern that forms amid a bearish trend and points toward its resumption. Traders place “sell” orders when the price breakouts in the bearish direction, in order to catch the resumed trend.
- Symmetrical triangle
A symmetrical triangle pattern is shaped like a normal triangle, with both upward and downward-sloping lines converging in one place. A symmetrical triangle incorporates a similar probability of trend continuation as well as trend reversal.
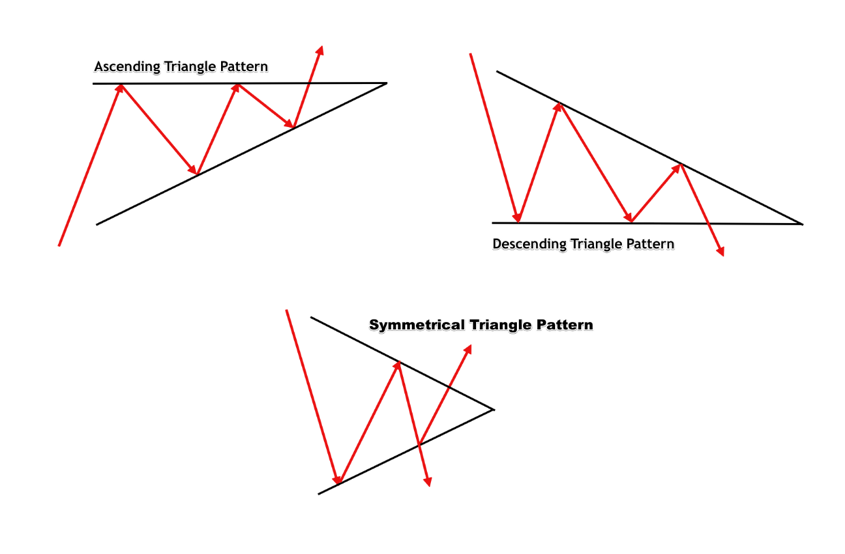
Note that triangles are mostly considered long-term continuation patterns as they are usually formed over a period of days or weeks.
2. Pennants
Pennants are similar to symmetrical triangles in shape but they are much smaller in scope. Contrary to the comprehensive swing highs and lows of a detailed triangle pattern, pennants incorporate only a small number of converging candle bars.
A pennant is usually developed after the price experiences a sudden one-direction movement. It stipulates the temporary consolidation period before the price gains momentum to again proceed with its move.
- A bullish pennant is a mini triangle-shaped continuation pattern that emerges after a security surges upward. It offers the traders “buy” opportunities when the price finally breakouts in the direction of the preceding move.
- Conversely, a bearish pennant forms after a strong bearish price move. The consolidation at the bearish pennant signifies that the price may continue its downward direction, allowing the traders to place “sell” orders on the breakout.

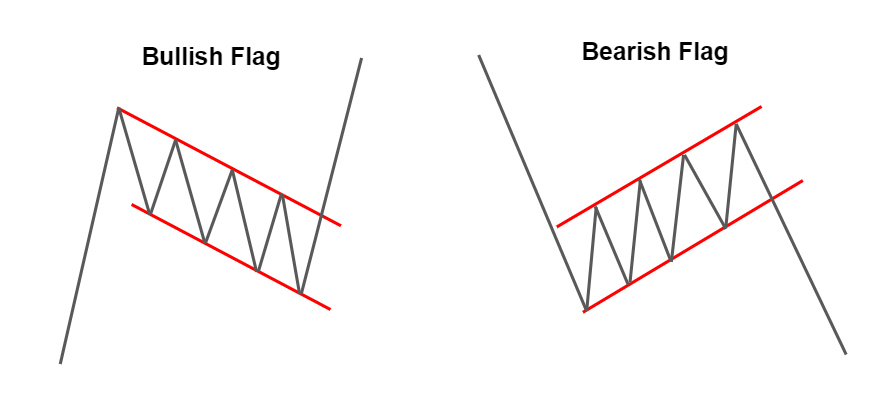
3. Flags
Flags are quite similar to pennants as in they both appear after a sharp and sudden price move. However, from a structural point of view, they both are different. A flag is formed by two parallel trendlines, either sloping upwards or downwards, as compared to triangular-shaped pennants.
- A bullish flag is denoted by a downward-sloping price channel, composed of two flat & parallel, support and resistance, trend lines. It forms after a swift bullish price move and signifies the continuation of the existing trend.
- A bearish flag is characterized by an upwardly tilted channel that forms after a strong downward price move. When the price breaks down the flag support, traders can enter “sell” positions to join the bearish price move.
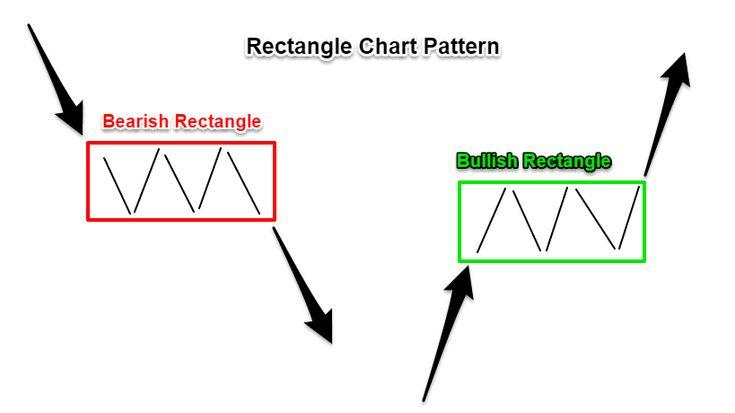
4. Rectangles
If you turn the slanting flag channel in a “sideways” direction, it can be called a rectangle pattern. Rectangles are signified by a “sideways moving price” that must be ranging between a parallel support and resistance zone. Like all continuation patterns, a rectangle formation stipulates a pause in the present trend whereby the price shows lateral consolidation and eventually carries on in its original direction.
- While the rectangle pattern looks the same in both cases, it signals that the price would continue in its upward direction if formed amid an existing bullish trend.
- Whereas it points out that the price would resume its bearish trajectory if appeared after an initial downward trend.
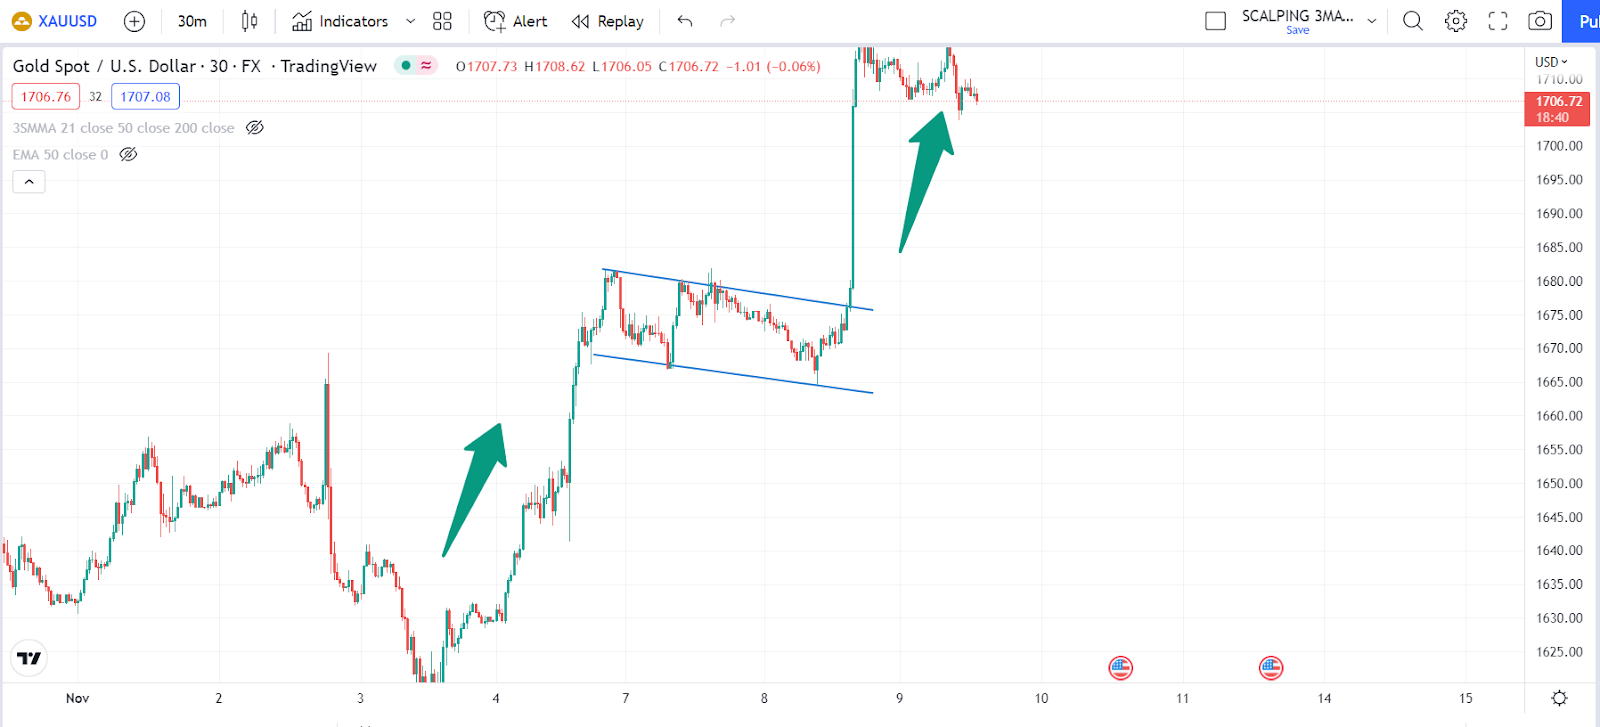
Example of a continuation trading pattern (bullish flag) in the forex market
The purpose of illustrating a real-world example is that patterns are not always so neat and perfect in real market conditions. However, they may still work if the basic conditions are fulfilled.
Have a look at this XAU/USD 30-minute chart below where a bullish flag pattern was formed recently, between 7th – 9th November 2022. As you can see the price sharply moved upward and then consolidated for 2-3 days, forming a downward slanting flag. Two ideal buy opportunities can be seen here. Some traders might have entered a position at the “support bounce” to grab a good entry point. Whereas conservative traders might have placed a “buy” order on the successful price breakout from the flag resistance.
Caution: No trading setup has a 100% win ratio. Even if some continuation patterns are apparently perfect, they might not lead to a continuation of the trend.
Read more:
http://thetradingbay.com/what-are-harmonic-patterns-in-trading-a-guide-to-4-major-patterns/